| Company | Console | CPU description | GPU description | CPU flops | GPU flops | CPU + GPU flops |
|---|---|---|---|---|---|---|
| SONY | PS2 | Emotion Engine (299MHz) | Graphics Synthesizer (147MHz) | 6,1 GFlops | 4,7 GFlops | 10,8 GFlops |
| PS3 | CELL (IBM) (3.2GHz) | RSX (NVidia) (500, 550 MHz) | 204,8 GFlops | 172,0 GFlops | 376,8 GFlops | |
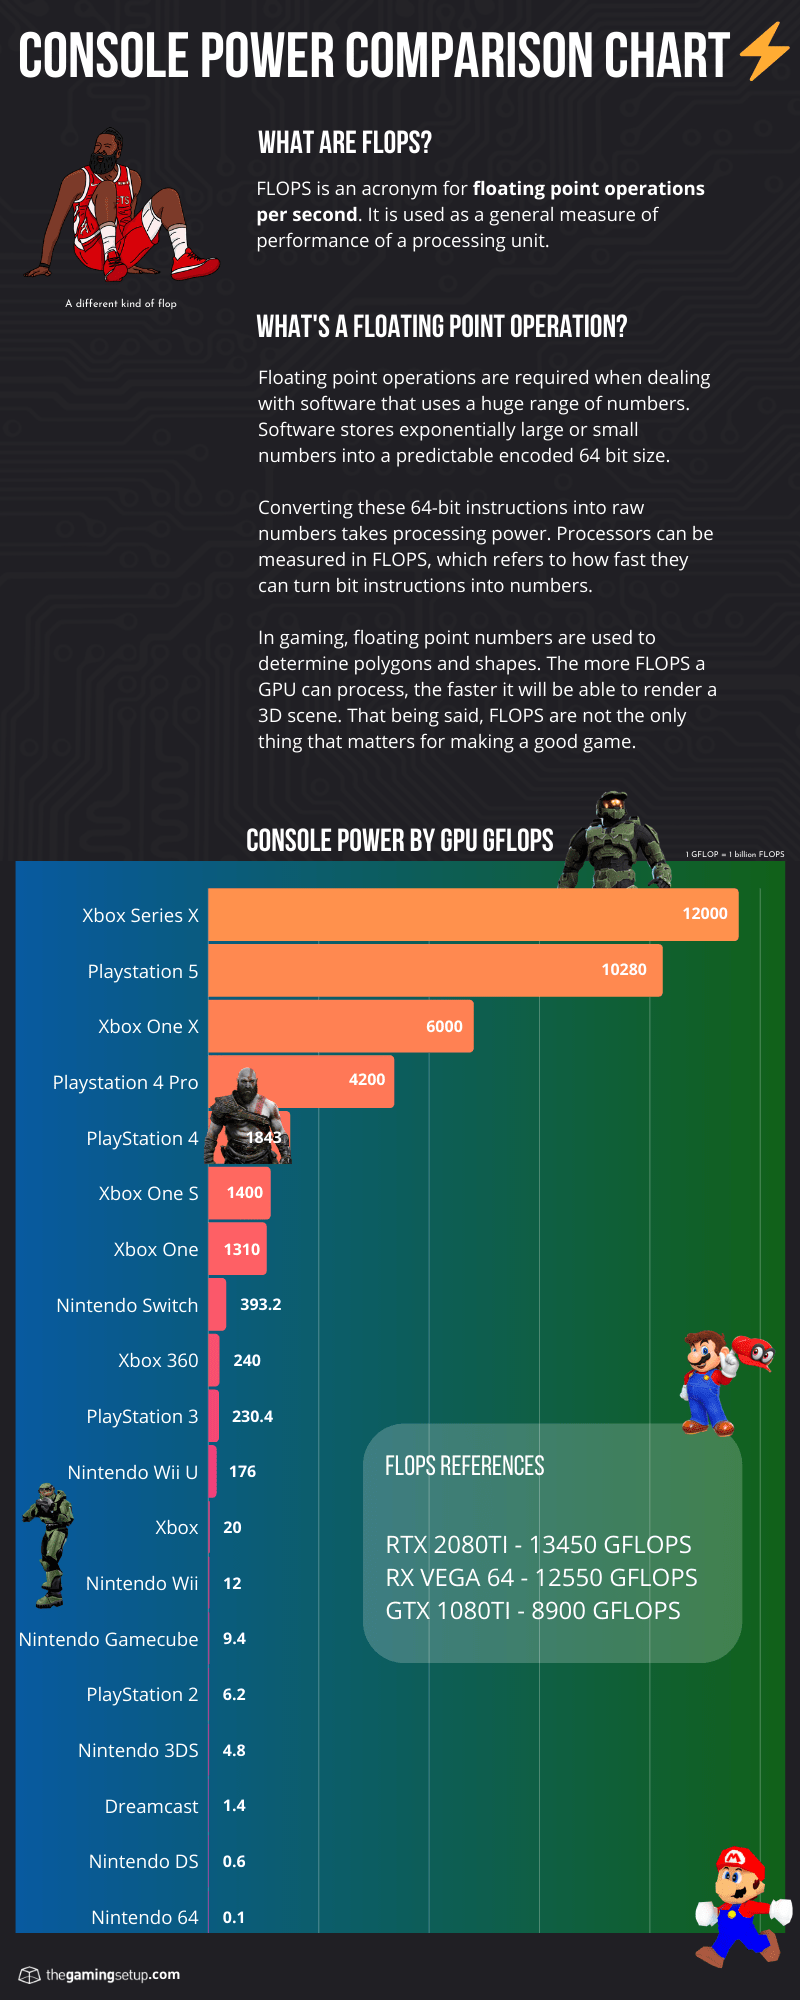
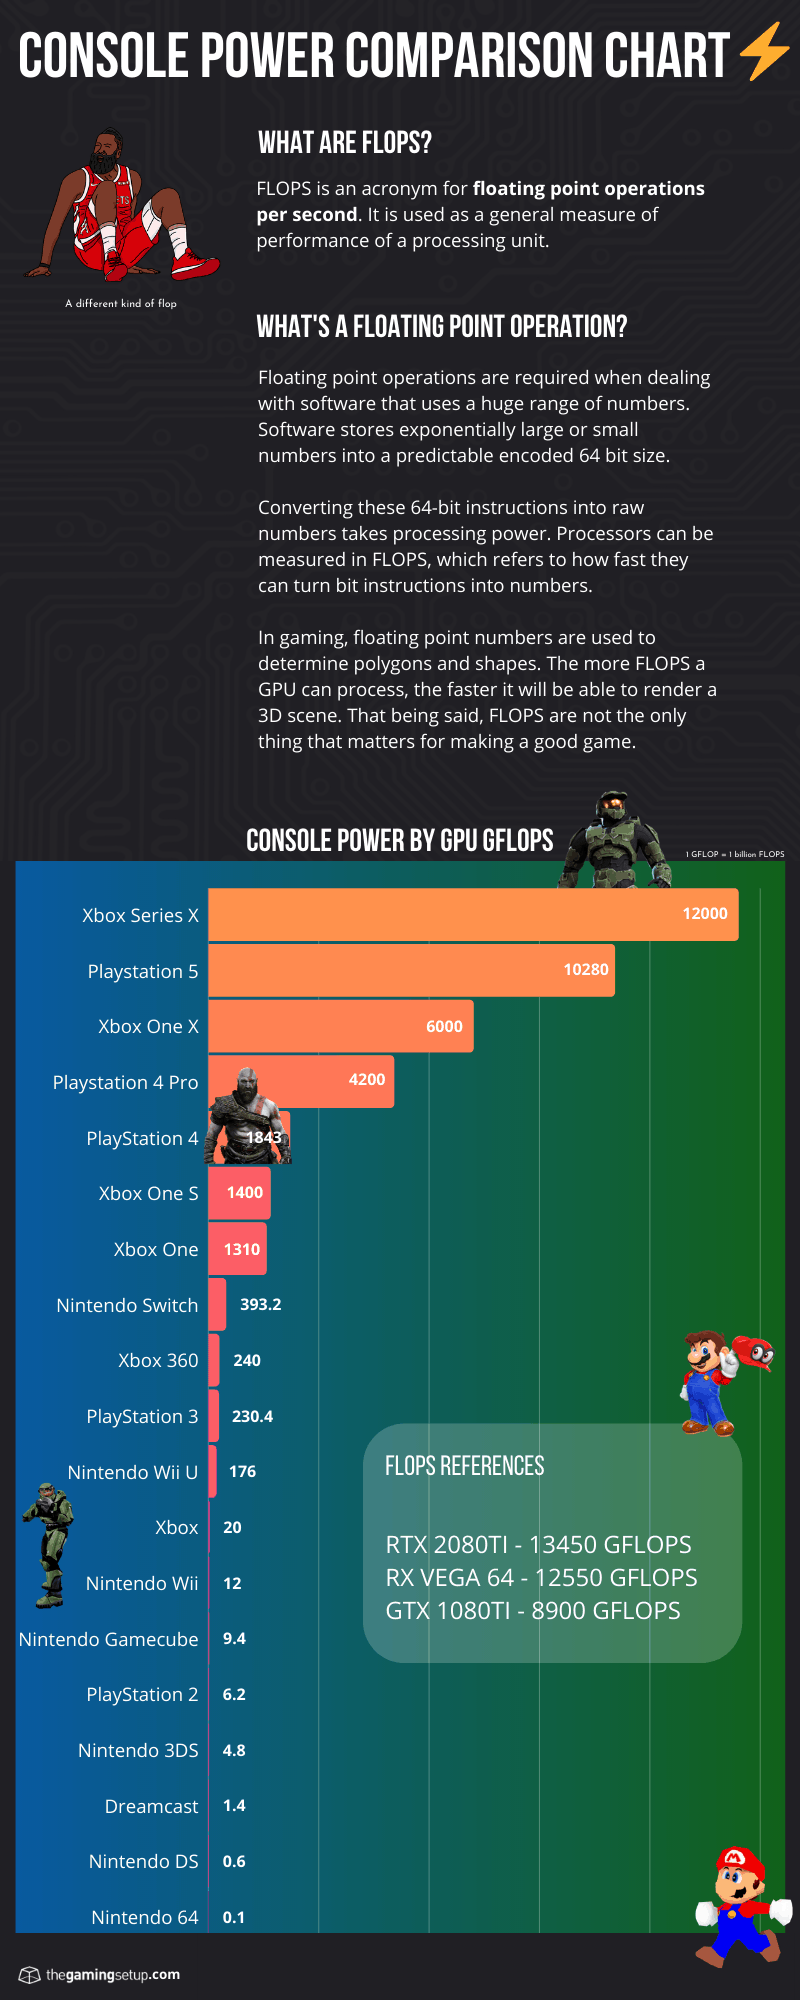
| PS4 | AMD Jaguar (1.6 GHz) | AMD GPGPU 18 CU (800 MHz) | 102,4 GFlops | 1 843,2 GFlops | 1 945,6 GFlops | |
| PS4 PRO | AMD Jaguar (2.1 GHz) | AMD GPGPU 36 CU (911 MHz) | 134,4 GFlops | 4 197,9 GFlops | 4 332,3 GFlops | |
| PS5 | AMD Zen 2 (3.5 GHz) | AMD RDNA2 36 CU (2230 MHz) | 448,0 GFlops | 10 275,8 GFlops | 10 723,8 GFlops | |
| Microsoft | XBOX | Pentium 3 (733 MHz) | Nvidia Geforce 3 (233 MHz) | 1,5 GFlops | 5,8 GFlops | 7,3 GFlops |
| XBOX 360 | Xenon (IBM) (3.2GHz) | Xenos (AMD) (500MHz) | 115,0 GFlops | 240,0 GFlops | 355,0 GFlops | |
| XBOX ONE | AMD Jaguar (1.75 GHz) | AMD GPGPU 12 CU (853 MHz) | 112,0 GFlops | 1 310,2 GFlops | 1 422,2 GFlops | |
| XBOX ONE S | AMD Jaguar (1.75 GHz) | AMD GPGPU 12 CU (914 MHz) | 112,0 GFlops | 1 404,0 GFlops | 1 516,0 GFlops | |
| XBOX ONE X | AMD Jaguar Evolved (2.3 GHz) | AMD GPGPU 40 CU (1172 MHz) | 147,2 GFlops | 6 000,6 GFlops | 6 147,8 GFlops | |
| XBOX SERIES X | AMD Zen 2 (3.8 GHz) | AMD RDNA2 52 CU (1825 MHz) | 486,4 GFlops | 12 147,2 GFlops | 12 633,6 GFlops | |
| Nintendo | Wii | Broadway (IBM) (729 MHz) | ATI HollyWood (243 MHz) | 8,8 GFlops | 12,2 GFlops | 20,9 GFlops |
| Wii U | Espresso (IBM) (1,243 GHz) | ATI Latte (550 MHz) | 14,9 GFlops | 352,0 GFlops | 366,9 GFlops | |
| Nintendo Switch | ARM Cortex-A57 (1,78 GHz 3 Core) | Nvidia Tegra X1 (921 MHz) | 21,4 GFlops | 471,5 GFlops | 492,9 GFlops |
Calculations:
| Year | Console | Single precision floating point instructions per seconds | Notes |
|---|---|---|---|
| CPUs | |||
| 2000.03.04. JP | Playstation 2 | Emotion Engine = (VPU0 ( 2 * 4 FMAC Flops + 1/7 * FDIV Flops ) + VPU1 ( 2 * 5 FMAC Flops + 2/7 * FDIV Flops ) + FPU (1 Flop + 1 * FDIV Flops)) * 299 MHz = 6,128 GFLOPs | FMACs - 1 addition and 1 multiplication in 1 cycle FDIVs - division in 7 cycles |
| 2001.11.15. NA | XBOX | Pentium 3 = 2 Flops * 733 MHz = 1,466 GFlops | |
| 2005.11.22. US | XBOX 360 | Xenon (IBM) = (3 PPE *(4 FPU Flops + 2 * 4 VMX128 Flops) * 3.2 GHz) = 115 GFlops | |
| 2006.11.11. JP | PS3 | CELL (IBM) = (1 PPE * (4 FPU Flops + 4 VMX Flops) * 3.2 Ghz) + (7 SPE * 8 Flops * 3.2 Ghz) = 204,8 GFlops | (8 SPEs, 1 SPE disabled) |
| 2006.11.19. US | Wii | Boradway (IBM) = (3 cores * 4 FPU Flops) * 729 MHz = 8,75 GFlops | |
| 2012.11.18. US | Wii U | Espresso (IBM) = (3 cores * 4 FPU Flops) * 1,243 Ghz = 14,916 GFlops | |
| 2013.11.13. NA | PS4 | Jaguar (AMD) = (8 FLOPs * 8 cores) * 1.6 GHz = 102,4 GFlops | |
| 2013.11.22. | XBOX ONE | Jaguar (AMD) = (8 FLOPs * 8 cores) * 1.75 GHz = 112 GFlops | |
| 2016.11.10. | PS4 Pro | Jaguar (AMD) = (8 FLOPs * 8 cores) * 2.1 GHz = 134,4 GFlops | |
| 2017.03.03. | Nintendo Switch | Cortex-A57 (ARM) = (3 cores * 4 flops ) * 1.78 GHz = 21,4 GFlops | |
| 2017.11.10. | XBOX ONE X | Jaguar Evolved(AMD) = (8 FLOPs * 8 cores) * 2.3 GHz = 147,2 GFlops | |
| PS5 | Zen 2(AMD) = (16 FLOPs * 8 cores) * 3.5 GHz = 448 GFlops | ||
| XBOX SERIES X | Zen 2(AMD) = (16 FLOPs * 8 cores) * 3.8 GHz = 486,4 GFlops | ||
| GPUs | |||
| Playstation 2 | Graphics Synthetiser = 16 pixel pipeline * 2 flops * 147 MHz = 4,704 GFlops | ||
| XBOX | Nvidia Geforce 3 = (4 pixel pipeline * 5 Flops + 1 vertex * 5 Flops) * 233 MHz = 5,825 GFlops | ||
| XBOX 360 | Xenos (AMD) = ( 48 shader processors * 10 Flops ) * 500 MHz = 240 GFlops | 64 shaders, 16 shaders disabled | |
| PS3 | RSX (NVIDIA) = ( 24 parallel pixel-shader * 10 Flops ) * 550 MHz + (8 parallel vertex-shader pipelines * 10 Flops) * 500 MHz = 172 GFlops | 28 pixel shaders, 4 pixel shader disabled | |
| Wii | ATI Hollywood (AMD) = (4 Pixel shaders * 10 Flops + 1 Vertex shader * 10 Flops) * 243 MHz = 12,15 GFlops | ||
| Wii U | ATI Latte (AMD) = (5 CU * 64 cores * 2flops) * 550 Mhz = 352 GFlops | ||
| PS4 | GPGPU (AMD) = (18 CU * 64 cores * 2 flops) * 800 MHz = 1843,2 GFlops | ||
| XBOX ONE | GPGPU (AMD) = (12 CU * 64 cores * 2 flops) * 853 MHz = 1310,208 GFlops | ||
| PS4 Pro | GPGPU (AMD) = (36 CU * 64 cores * 2 flops) * 911 MHz = 4197,9 GFlops | ||
| Nintendo Switch | Tegra X1 (NVIDIA) = (1 FP 32 * 2 FMA * 256 CUDA) * 921 MHz = 471,5 GFlops | ||
| XBOX ONE X | GPGPU (AMD) = (40 CU * 64 cores * 2 flops) * 1172 MHz = 6000,64 GFlops | ||
| PS5 | GPGPU (AMD) = (36 CU * 64 cores * 2 flops) * 2230 MHz = 10275,84 GFlops | ||
| XBOX SERIES X | GPGPU (AMD) = (52 CU * 64 cores * 2 flops) * 1825 MHz = 12147,2 GFlops |
Sheets about console performances in flops starting from PS2.
Feel free to comment to fix possible errors in calculations.
Last edited:


 . Like, I always knew it from 2013 but actually seeing the numbers next to 360 and PS3's CPUs it's kind of startling in a way.
