Parmenides
Banned
-Sony Corporation, the world's largest game console maker,announced its consolidated results for the the fiscal year ended March 31,2011 (Apr 1,2010 to Mar 31,2011)
-Sony Corporation posted an operating income of $2.4 billion
-The company reported a net loss of $3.12 billion
-Net income decreased by approximately $4 billion from the February forecast primarily due to a non-cash charge to establish a valuation allowance of approximately $4.4 billion against certain deferred tax assets in Japan
-The non-cash charge to establish a valuation allowance does not have any impact on Sonys consolidated operating income or cash flow nor does such an allowance preclude Sony from using the loss carry forwards or other deferred tax assets in the future
-The establishment of this valuation allowance does not reflect a change in Sonys view of its long-term corporate strategy.Sony expects that consolidated sales will be higher,that operating income will be approximately the same as for the previous fiscal year and that it will record net income attributable to Sonys stockholders
-NPS (includes Sony's Game Business) posted an operating income of $429 million
-For the current fiscal year ending March 31, 2012, Sony expects to sell 15 million PS3s, 6 million PSPs and 4 million PS2s
-Beginning with the quarter ended June 30,2007,the method of reporting hardware and software unit sales has been changed from production shipments to recorded sales
PSP Worldwide Unit Sales/Production Shipments (Unit:Million)
PS2 Worldwide Unit Sales/Production Shipments (Unit:Million)
PS3 Worldwide Unit Sales (Unit:Million)
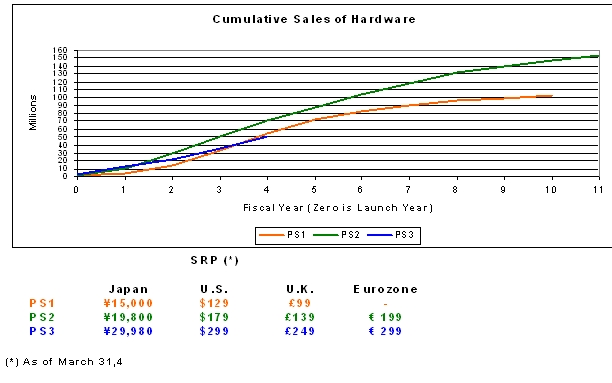
Worldwide Hardware Sales (Ja-Mr) 2011


-Sony Corporation posted an operating income of $2.4 billion
-The company reported a net loss of $3.12 billion
-Net income decreased by approximately $4 billion from the February forecast primarily due to a non-cash charge to establish a valuation allowance of approximately $4.4 billion against certain deferred tax assets in Japan
-The non-cash charge to establish a valuation allowance does not have any impact on Sonys consolidated operating income or cash flow nor does such an allowance preclude Sony from using the loss carry forwards or other deferred tax assets in the future
-The establishment of this valuation allowance does not reflect a change in Sonys view of its long-term corporate strategy.Sony expects that consolidated sales will be higher,that operating income will be approximately the same as for the previous fiscal year and that it will record net income attributable to Sonys stockholders
-NPS (includes Sony's Game Business) posted an operating income of $429 million
-For the current fiscal year ending March 31, 2012, Sony expects to sell 15 million PS3s, 6 million PSPs and 4 million PS2s
-Beginning with the quarter ended June 30,2007,the method of reporting hardware and software unit sales has been changed from production shipments to recorded sales
PSP Worldwide Unit Sales/Production Shipments (Unit:Million)
Code:
Hardware Sales   Ap-Jn    Jl-Sp    Oc-Dc    Ja-Mr     FY       LTD

FY 2006/07        1.4      2.0      4.7      1.5      9.6      9.6

FY 2007/08        2.1      2.5      5.7      3.5      13.8     23.4

FY 2008/09        3.7      3.2      5.1      2.1      14.1     37.5

FY 2009/10        1.3      3.0      4.2      1.4      9.9      47.4

FY 2010/11        1.2      1.5      3.6      1.7      8.0      55.4

March 31,2006  Cumulative  Production Shipments of Hardware    17.03

LTD Hardware Unit Sales + Cumulative  Production Shipments     72.43


Software Sales   Ap-Jn    Jl-Sp    Oc-Dc    Ja-Mr     FY       LTD

FY 2006/07        9.2      13.2     21.2     11.1     54.7     54.7

FY 2007/08        9.8      12.6     18.3     14.8     55.3     110.0

FY 2008/09        11.8     11.8     15.5     11.2     50.3     160.3

FY 2009/10        8.3      13.0     15.0     8.1      44.4     204.7

FY 2010/11        9.2      11.0     16.5     9.9      46.6     251.3

March 31,2006  Cumulative  Production Shipments of Software    47.3

LTD Software Unit Sales + Cumulative  Production Shipments     298.6
Code:
Hardware Sales   Ap-Jn    Jl-Sp    Oc-Dc    Ja-Mr     FY       LTD

FY 2006/07        2.3      3.4      6.7      2.4      14.8     14.8

FY 2007/08        2.7      3.2      5.4      2.4      13.7     28.5

FY 2008/09        1.5      2.5      2.5      1.4      7.9      36.4

FY 2009/10        1.6      1.9      2.1      1.7      7.3      43.7

FY 2010/11        1.6      1.5      2.1      1.2      6.4      50.1

March 31,2006  Cumulative  Production Shipments of Hardware    103.69

LTD Hardware Unit Sales + Cumulative  Production Shipments     153.79


Software Sales    Ap-Jn    Jl-Sp    Oc-Dc    Ja-Mr     FY       LTD

FY 2006/07        32.7     47.2     78.6     35.0     193.5    193.5

FY 2007/08        31.1     38.0     60.9     24.0     154.0    347.5

FY 2008/09        19.3     23.2     29.7     11.3     83.5     431.0

FY 2009/10        8.5      11.4     11.2     4.6      35.7     466.7

FY 2010/11        3.4      5.6      5.3      2.1      16.4     483.1

March 31,2006  Cumulative  Production Shipments of Software    1047.0

LTD Software Unit Sales + Cumulative  Production Shipments     1530.1
Code:
Hardware Sales   Ap-Jn    Jl-Sp    Oc-Dc    Ja-Mr     FY       LTD

FY 2006/07         -        -       1.7      1.8      3.5      3.5

FY 2007/08        0.7      1.3      4.9      2.2      9.1      12.6

FY 2008/09        1.6      2.4      4.5      1.6      10.1     22.7

FY 2009/10        1.1      3.2      6.5      2.2      13.0     35.7

FY 2010/11        2.4      3.5      6.3      2.1      14.3     50.0


Software Sales   Ap-Jn    Jl-Sp    Oc-Dc    Ja-Mr     FY       LTD

FY 2006/07         -        -       5.2      8.1      13.3     13.3

FY 2007/08        4.7      10.4     26.0     16.8     57.9     71.2

FY 2008/09        22.8     21.2     40.8     18.9     103.7    174.9

FY 2009/10        14.8     23.9     47.6     29.3     115.6    290.5

FY 2010/11        24.8     35.3     57.6     30.2     147.9    438.4
Code:
Hardware Sales (Unit:Million)

      (Ap-Jn)10   (Jl-Sp)10    (Oc-Dc)10    (Ja-Mr)11    FY       LTD


PS3      2.4        3.5          6.3          2.1        14.3     50.0

Wii      3.04       1.93         8.75         1.36       15.08    86.01

360      1.5        2.8          6.3          2.7        13.3     53.6

PS2      1.6        1.5          2.1          1.2        6.4      153.79


FY 2011/12 FCT

PS3    Wii     PS2

15.0   13.0    4.0
Worldwide Hardware Sales (Ja-Mr) 2011
Code:
    Sell-through (*)       Sell-in

PS3     2.45                 2.1

360     2.09                 2.7

Wii     2.00                 1.36

(1)Europe+Japan+U.S.