RubxQub
ÏÎ¯Î»Ï á¼Î¾ÎµÏÎÎ³Î»Î¿Ï Ïον καί ÏÎµÏ Î´Î¿Î»Ïγον οá½Îº εἰÏÏν
I know Apple was trolling the gaming industry with their charts, but it looks like they are actually embarrassing the big boys pretty badly in terms of gaming revenue for portable systems. Not at all comparing the experiences provided by each platform, but clearly the stand-alone portable gaming machine is going the way of the dinosaur.
Is It Game Over for Nintendo and Sony?
Is It Game Over for Nintendo and Sony?
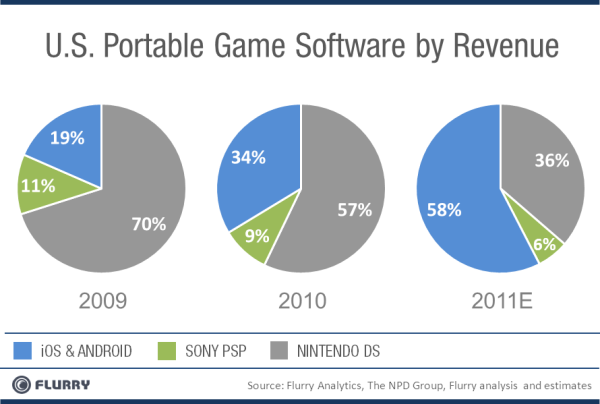
The chart displays the share of U.S. revenue generated for portable games from 2009 to 2011. Note that we project November and December for 2011, based on their ratio to the first 10 months of the year, as observed in 2009 and 2010. Starting on the left, for 2009, we calculate $2.7 billion in total U.S. portable game revenue. For 2010 and 2011, we estimate $2.5 billion and $3.3 billion, respectively.
The most striking trend is that iOS and Android games have tripled their market share from roughly 20% in 2009 to nearly 60% in just two years. Simultaneously, Nintendo, the once dominant player, has been crushed down to owning about one-third of market in 2011, from having controlled more than two-thirds in 2009. Combined, iOS and Android game revenue delivered $500 million, $800 million and $1.9 billion over 2009, 2010 and 2011, respectively.
As reported by Flurry earlier this year, the freemium game model is revolutionizing and expanding revenue on mobile devices. And just as smartphone game revenue has climbed aggressively, Nintendo DS and Sony PSP revenue has dropped precipitously. Over the last three years, Nintendo and Sony posted a combined $2.2 billion, $1.6 billion and $1.4 billion for 2009, 2010 and 2011, respectively.
Within the portable category, an abundance of digitally distributed free and $0.99 games, available on hardware, that is both comparably priced and more powerful than traditional portable game devices, better appeals to many consumers. As a result, the days of paying $25, or more, for a cartridge at a retail store may soon end. Further, the installed base of iOS and Android devices has not only reached critical mass, but also continues to grow at unprecedented rates. In their latest public statements regarding installed base, Apple and Google reported a total of 250 million iOS devices and 190 million Android devices activated, respectively.
Due in part to its demise in the portable game category, Nintendo is facing its first fiscal year loss since the company began reporting profits in 1981. Combined with slumping Wii sales, Nintendo is indeed struggling, even with its powerful stable of original IP led by Mario Brothers, and despite the fact that the exchange rate between the Japanese Yen and U.S. dollar is currently in its favor.
Equally concerning for Nintendo is that the battle for video game dominance is entering the living room, with entries by both Apple and Google into the TV category. Ostensibly, this new class of hardware will create a new platform upon which the digital distribution model of apps will be overlaid. Now, in addition to tablet form-factor competition, the console game industry, which currently pits Microsoft, Sony and Nintendo against each other, will additionally face competition from Apple and Google TV initiatives. Beyond 2011, if Nintendo continues to face financial hardship, it may be forced to consider difficult choices such as divesting its hardware business and distributing its content, for the first time, across non-proprietary platforms.
A Note about Methodology
For this analysis, Flurry used a combination of publicly available data, released across several reports by the NPD group, along with its own data collected from mobile devices. Flurry Analytics tracks more than 20 billion use sessions per month across more than 125,000 applications on more than 330 million unique devices per month. Nearly 40% of all app use sessions occur in games. With its coverage across applications, Flurry can reliably estimate the revenue generated per ranked position in the iTunes App Store and Android Market. With this data, Flurry calculated year-over-year revenue generated by the smartphone gaming category, and combined this with available Nintendo DS and Sony PSP software sales.

