DemonCleaner
Member
[disclaimer: this is a work in progress post]
Hey fellows,
so some may remember my old Gonzalo-Thread where I simulated the back then rumoured PS5 prototype with the newly release RX 5700XT graphics cards. So back in Summer 2019 we knew nothing official on the PS5 specs. Today we know a whole lot more, rangig from architecture details to clockspeeds.
Last week the RX6700XT released and i snatched one up to do a follow up analysis. Now with an actually comparable RDNA2-based GPU and the now known CPU configuration.
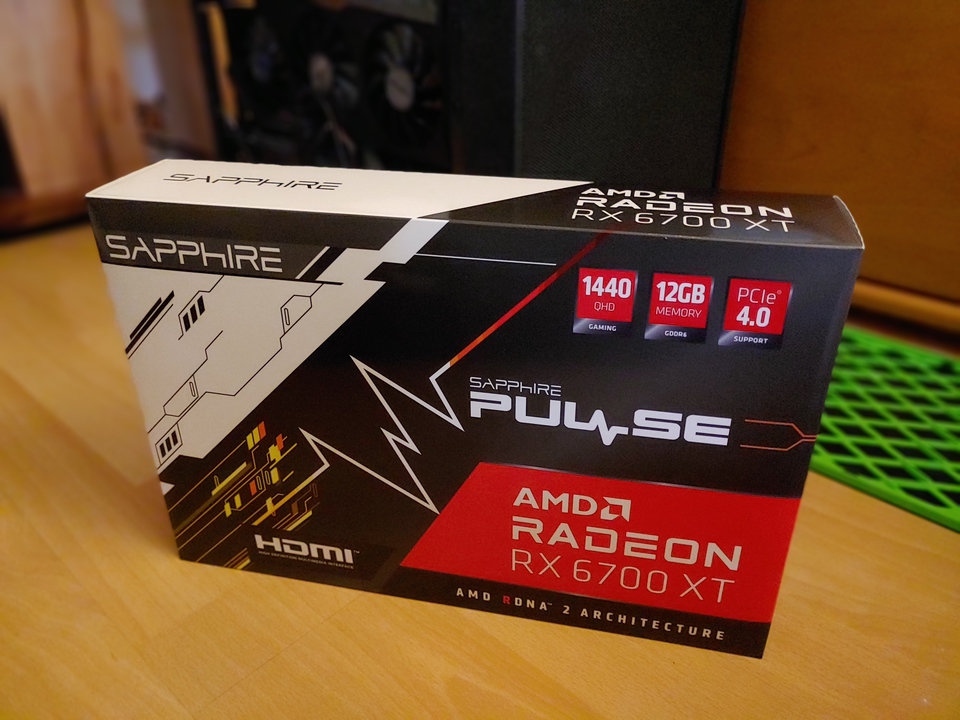
This is the worst overclocker i've ever had (at stock it doesn't even quite archive the ref cards clocks) and it seems Sapphire is selecting ASIC quality for their better range of cards. In this case that's a good thing, because it means that's pretty much the worst case scenario for efficiency.
So before showing first results and explaining the methodology here's a summary of what we are dealing with.

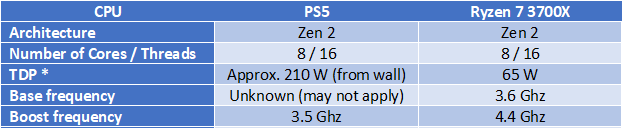
*in case of PS5 that's total observed power draw from the wall which equates to the sum of all components TDP [on the AC side]
Further used PC-Components:
650W Gold PSU
2x8GB Samsung B-die running 3600Mhz
B450 Motherboard
Sata SSD
Sata HDD
additional fans
Methodology:
The CPU gets underclocked to PS5 levels (and undervolted to get realistic working conditions in an console environment - SOC voltages sadly aren't known for PS5 atm afaik)

The GPU is also underclocked and slightly undervolted. To understand why the frequency is set to 2.315 GHz instead of 2.23 you have to understand that there is an offset within the AMD Navi boosting algorithm that prevents it from reaching it's frequency goal. To archieve a 2.2 GHz clockrate i needed to adjust the frequency goal as shown (f_goal might vary depending on load):

Power is monitored at the wall, as well as in software via the driver sensor outputs of the measured rails.
Please note, that because of Infinity Cache the RX6700XT is expected to be a bit more efficient than the PS5. On the other hand my PC has a lot more auxiliary power load than a console (double ram pools, more fans, IO etc.)
Results (sneak peak):
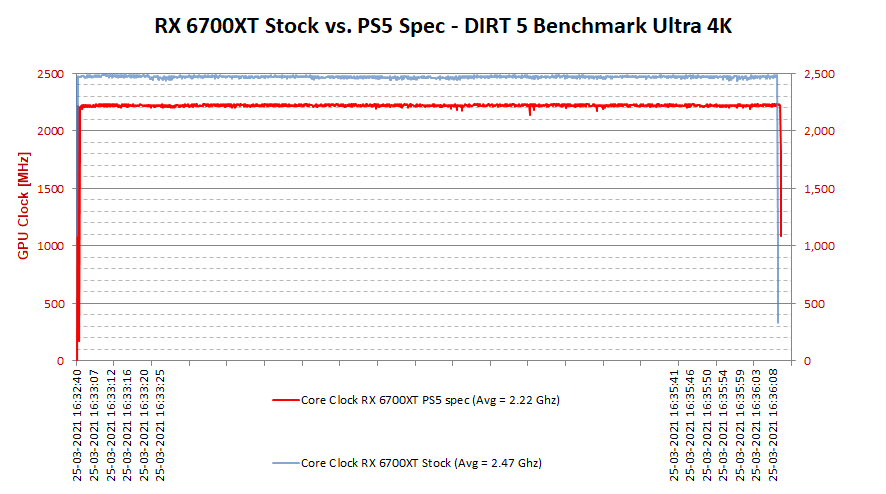
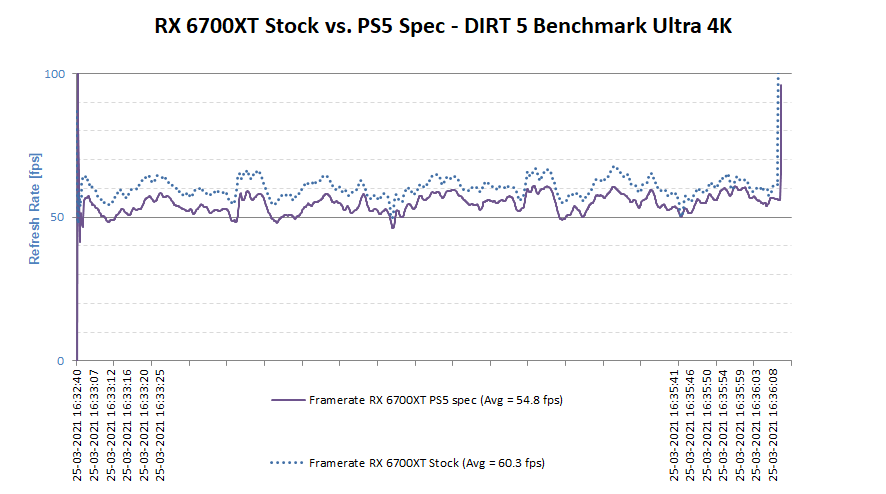
Dirt 5 Benchmark Ultra 4K - Resolution scaling off
GPU frequency
FPS
Total GPU Power (driver)*
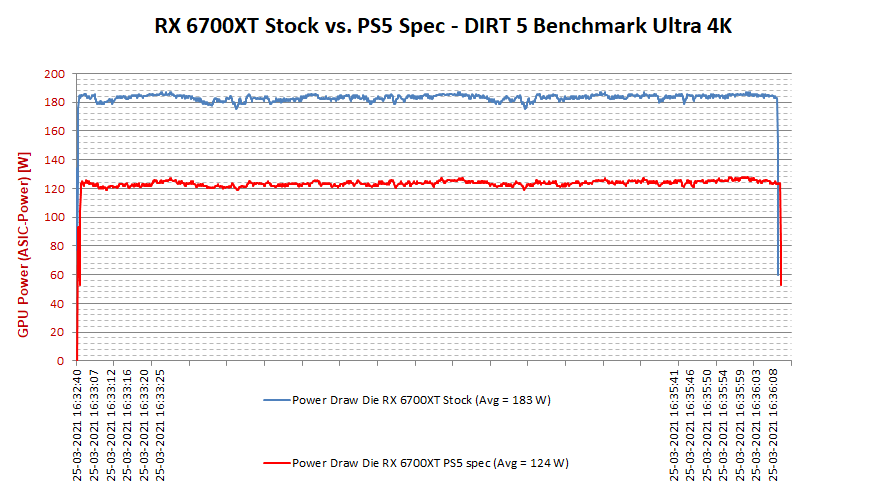
*please note: the RX 6700XT is measuring more rails than the first gen Navi 5700XT, hence the total power load output from the driver isn't comparable!!!
Power consumption whole system (at the wall)*:
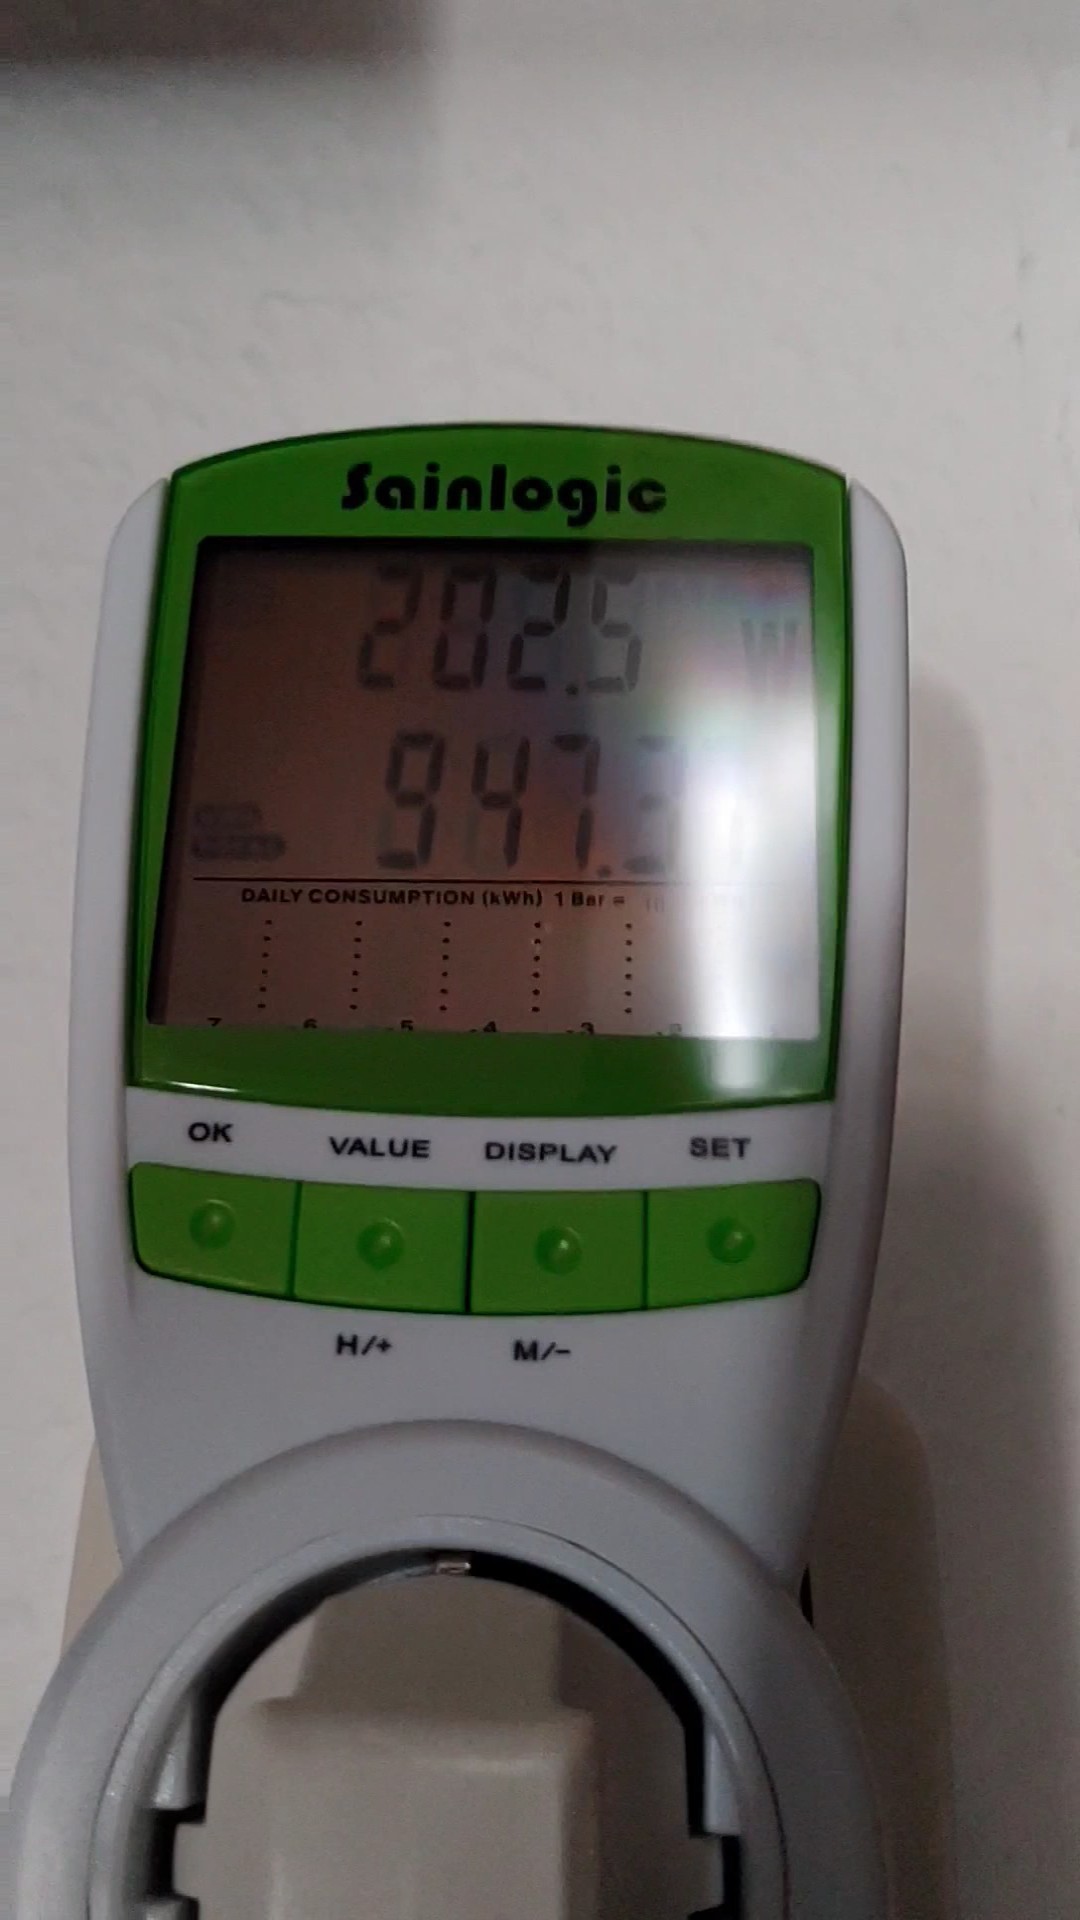
Hovers around 200W constantly (video follows if demanded) without much fluctuation (+/-5W)
*please note that this figure is not directly comparable to the driver side measuremeant because of power conversion / PSU efficiency losses. 200W at the wall roughly equates to 180W on the 12V DC side of things.
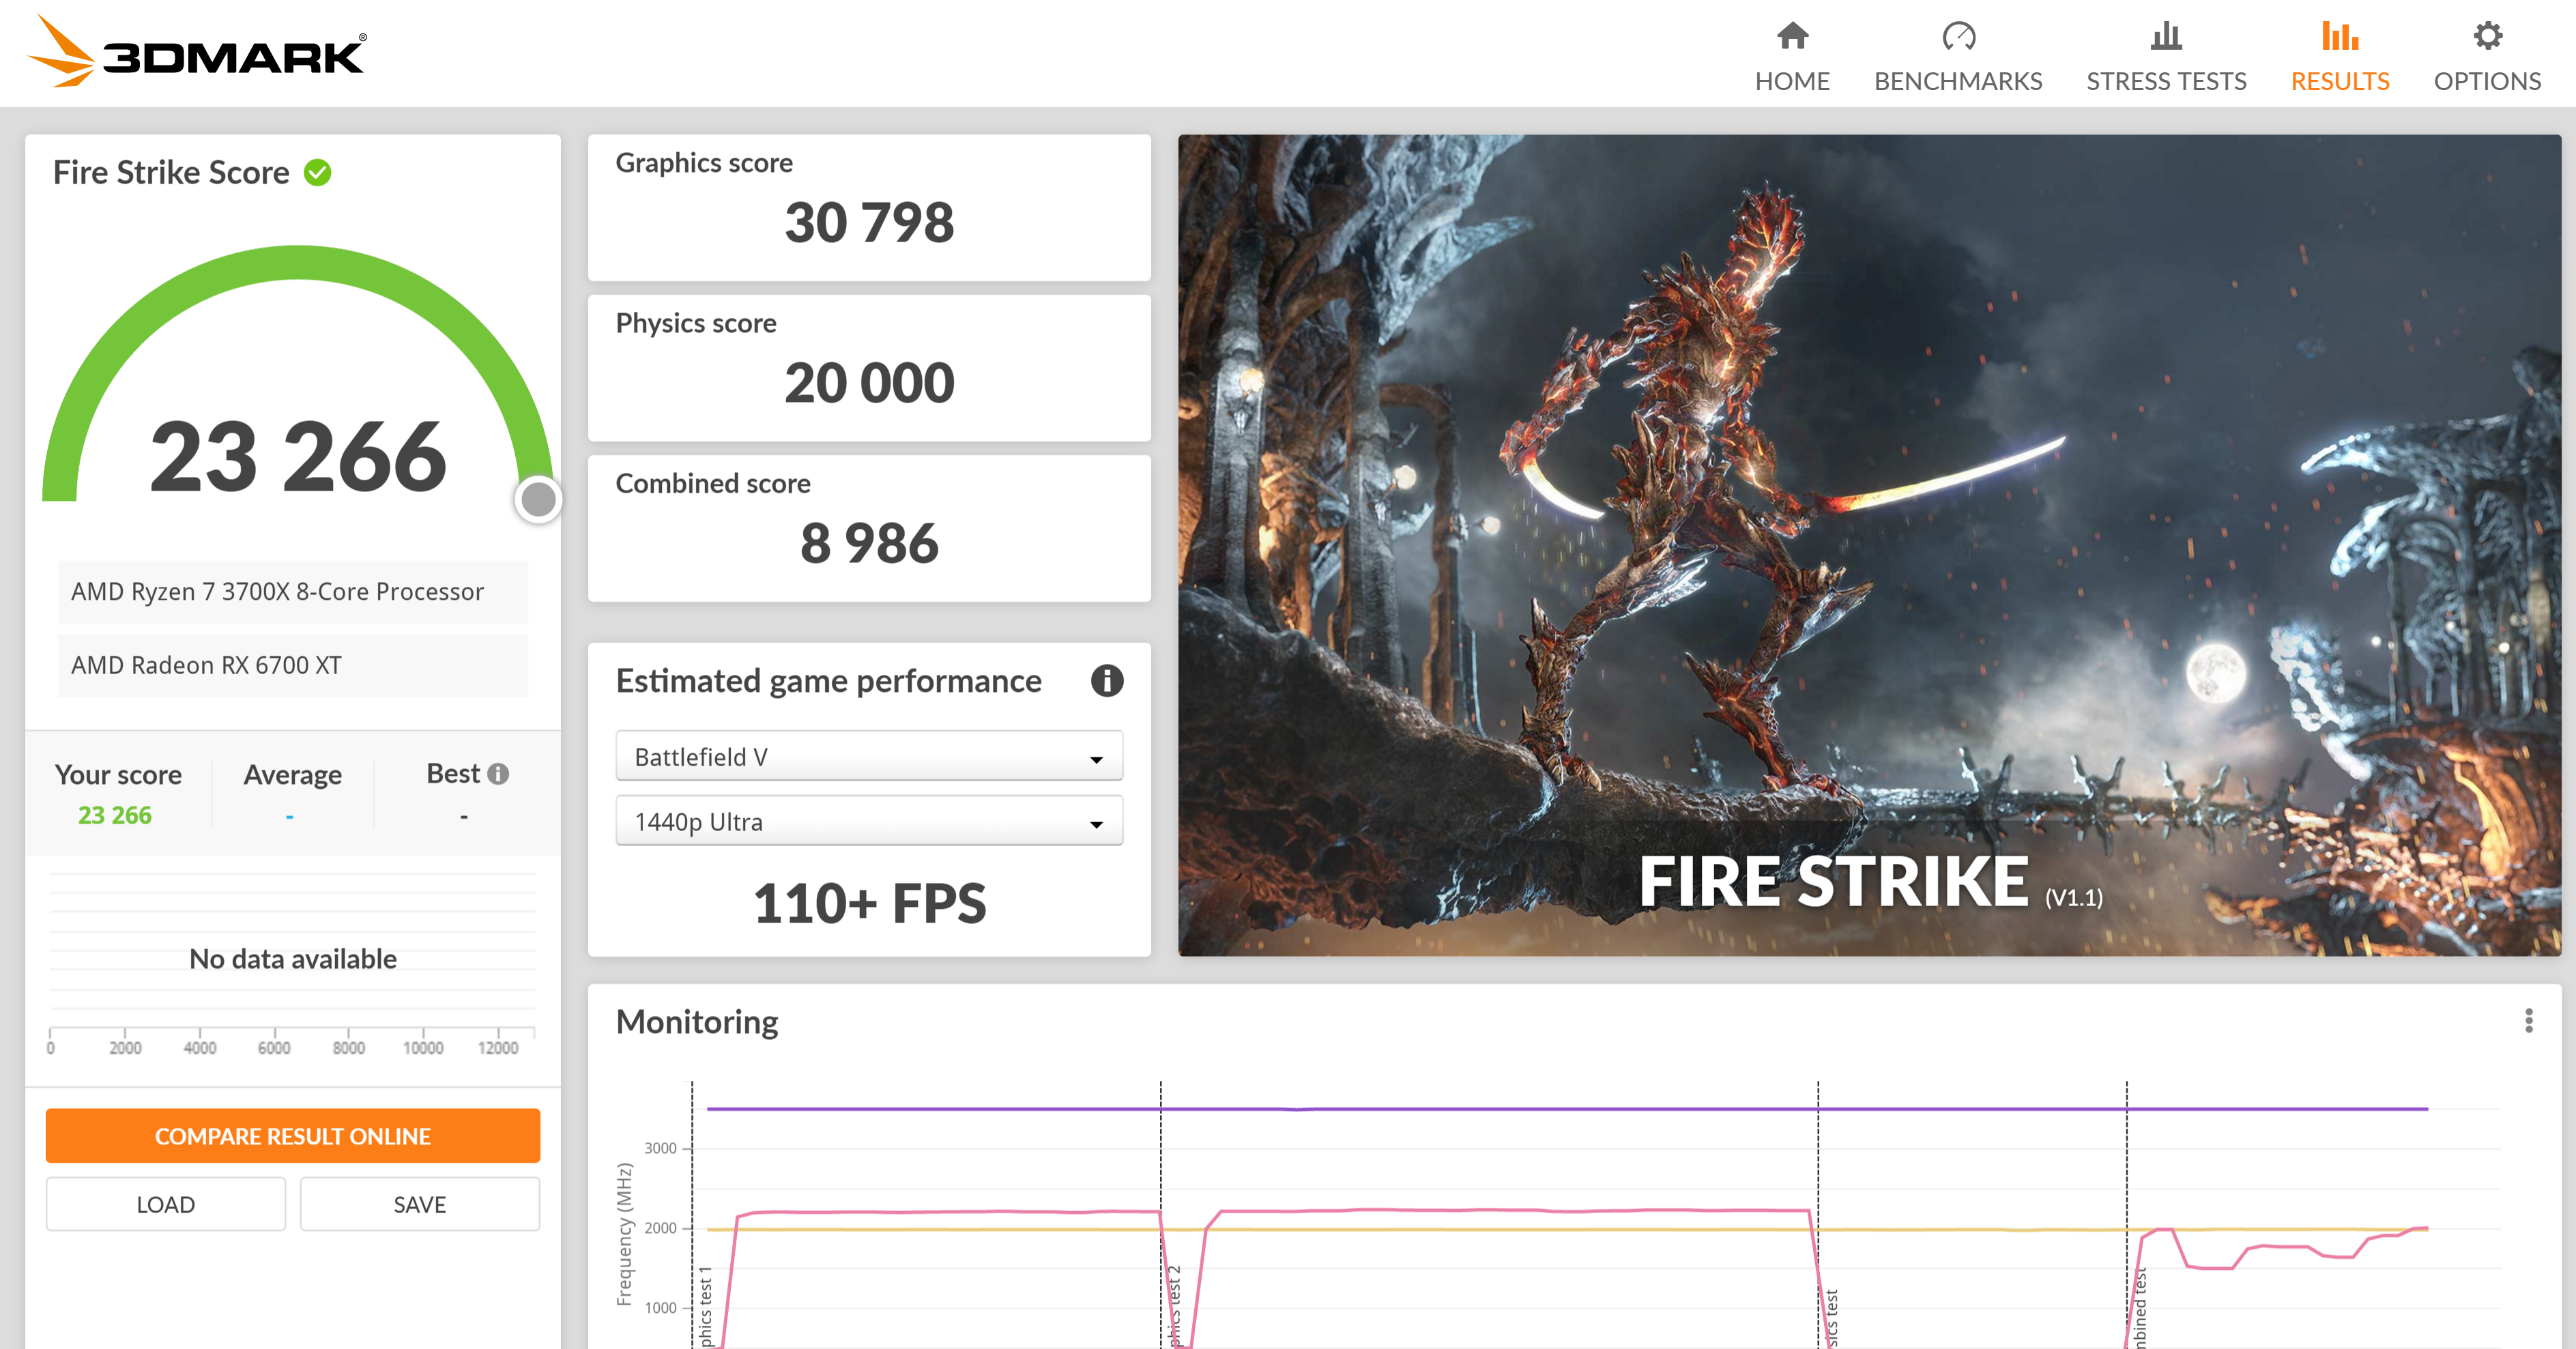
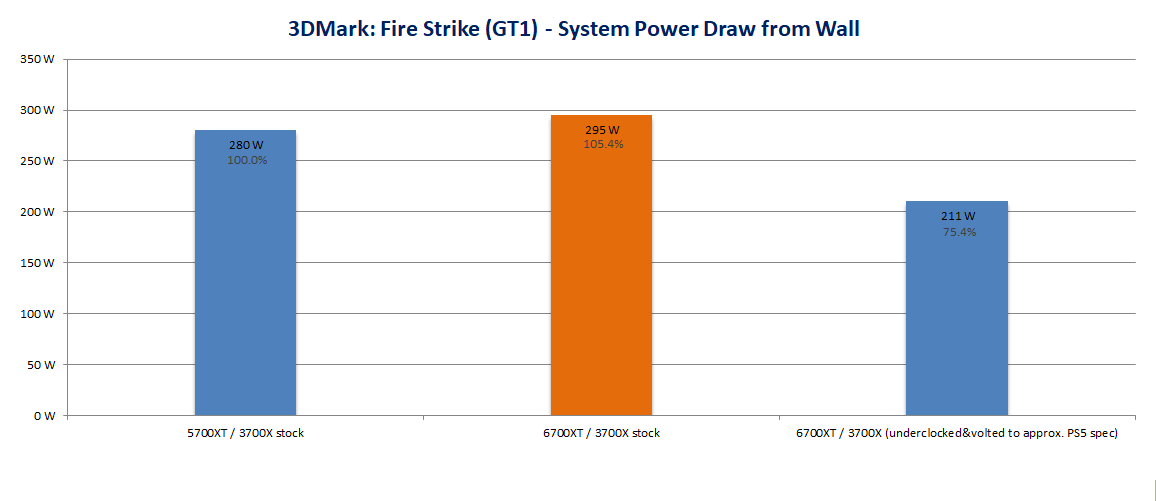
3D Mark FireStrike:
more indepth results following. after more stability testing i changed the base spec slightly (3700x 1.0V, 6700xt 1140mV at f_goal). This time around the well known synthetic benchmark firestrike:
Scores vs System Power:

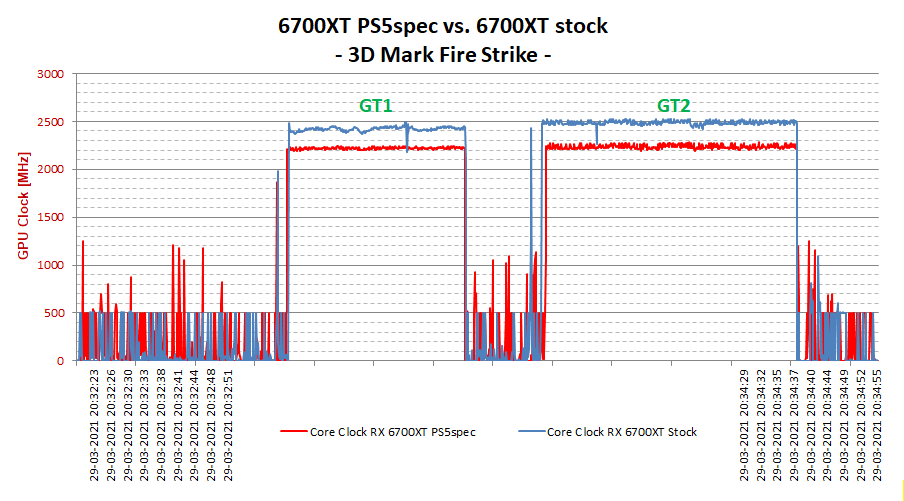
Frequency:
GPU Power:
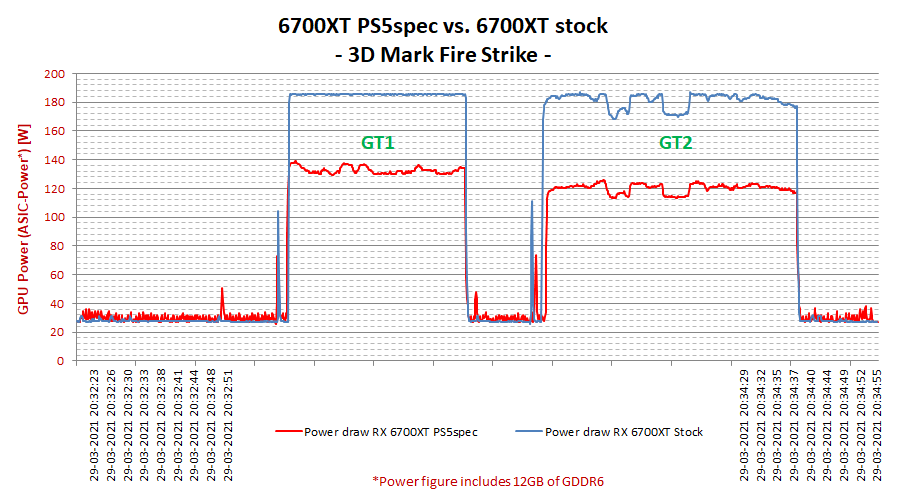
Graphics Test 1 is the more power hungry of both tests. I gathered the wall power figure during GT1. that said, GT2 seems to be more representative for a real game workload (the frequency offset seemed to shrink during GT2 which resulted in very slightly higher clocks also)
Hey fellows,
so some may remember my old Gonzalo-Thread where I simulated the back then rumoured PS5 prototype with the newly release RX 5700XT graphics cards. So back in Summer 2019 we knew nothing official on the PS5 specs. Today we know a whole lot more, rangig from architecture details to clockspeeds.
Last week the RX6700XT released and i snatched one up to do a follow up analysis. Now with an actually comparable RDNA2-based GPU and the now known CPU configuration.
This is the worst overclocker i've ever had (at stock it doesn't even quite archive the ref cards clocks) and it seems Sapphire is selecting ASIC quality for their better range of cards. In this case that's a good thing, because it means that's pretty much the worst case scenario for efficiency.
So before showing first results and explaining the methodology here's a summary of what we are dealing with.
*in case of PS5 that's total observed power draw from the wall which equates to the sum of all components TDP [on the AC side]
Further used PC-Components:
650W Gold PSU
2x8GB Samsung B-die running 3600Mhz
B450 Motherboard
Sata SSD
Sata HDD
additional fans
Methodology:
The CPU gets underclocked to PS5 levels (and undervolted to get realistic working conditions in an console environment - SOC voltages sadly aren't known for PS5 atm afaik)
The GPU is also underclocked and slightly undervolted. To understand why the frequency is set to 2.315 GHz instead of 2.23 you have to understand that there is an offset within the AMD Navi boosting algorithm that prevents it from reaching it's frequency goal. To archieve a 2.2 GHz clockrate i needed to adjust the frequency goal as shown (f_goal might vary depending on load):
Power is monitored at the wall, as well as in software via the driver sensor outputs of the measured rails.
Please note, that because of Infinity Cache the RX6700XT is expected to be a bit more efficient than the PS5. On the other hand my PC has a lot more auxiliary power load than a console (double ram pools, more fans, IO etc.)
Results (sneak peak):
Dirt 5 Benchmark Ultra 4K - Resolution scaling off
GPU frequency
FPS
Total GPU Power (driver)*
*please note: the RX 6700XT is measuring more rails than the first gen Navi 5700XT, hence the total power load output from the driver isn't comparable!!!
Power consumption whole system (at the wall)*:
Hovers around 200W constantly (video follows if demanded) without much fluctuation (+/-5W)
*please note that this figure is not directly comparable to the driver side measuremeant because of power conversion / PSU efficiency losses. 200W at the wall roughly equates to 180W on the 12V DC side of things.
3D Mark FireStrike:
more indepth results following. after more stability testing i changed the base spec slightly (3700x 1.0V, 6700xt 1140mV at f_goal). This time around the well known synthetic benchmark firestrike:
Scores vs System Power:
Frequency:
GPU Power:
Graphics Test 1 is the more power hungry of both tests. I gathered the wall power figure during GT1. that said, GT2 seems to be more representative for a real game workload (the frequency offset seemed to shrink during GT2 which resulted in very slightly higher clocks also)
Last edited:
")