http://www.nintendo.co.jp/ir/en/index.html
(in millions of yen)
Net sales are actually lower than forecast, which is bad. The main reason the losses weren't as great is:
Edit: sorry for the crappy OP, I'm slightly busy, will update in about half an hour
---
Update 2:
Forecast for next year: (This year's results are below)
FY 2012/13 Nintendo Forecast (Unit:Million)
Update:
Expected Losses: $800 Million
Actual Losses: $532 Million
(**) FY 2011/12 Actual (Unit:Million)
(**) FY 2011/12 Revised Forecast (Unit:Million)
(*) Original Forecast (Unit:Million)
Code:
               Net sales  Operating  Ordinary  Net Income
Jan forecast   660,000    -45,000    -95,000   -65,000
Actual result 647,652 -37,320 -60,863 -43,204Net sales are actually lower than forecast, which is bad. The main reason the losses weren't as great is:
Yen was depreciated beyond our exchange rates assumptions in terms of the rates at the end of the fiscal year, and assets in foreign currencies evaluated by the exchange rates at the end of the fiscal year generated valuation profit (reversal of valuation loss). Therefore, ordinary loss and net loss became smaller than we had assumed.
Edit: sorry for the crappy OP, I'm slightly busy, will update in about half an hour
---
Update 2:
Forecast for next year: (This year's results are below)
FY 2012/13 Nintendo Forecast (Unit:Million)
Code:
               3DS       NDS      (Wii +Wii U)

Hardware       18.5      2.5          10.5

Software       73.0      37.0         70.0
Update:
Expected Losses: $800 Million
Actual Losses: $532 Million
(**) FY 2011/12 Actual (Unit:Million)
Code:
                   NDS       Wii      3DS

Hardware Sales      5.1      9.84      13.53

Software Sales      59.0     102.37    36.0


(**)January 26, 2012
(**) FY 2011/12 Revised Forecast (Unit:Million)
Code:
                   NDS       Wii      3DS

Hardware Sales      5.5      10.0     14.0

Software Sales      59.0     100.0    38.0


(**)January 26, 2012
(*) Original Forecast (Unit:Million)
Code:
                   NDS       Wii      3DS

Hardware Sales      11.0     13.0     16.0

Software Sales      67.0     120.0    62.0

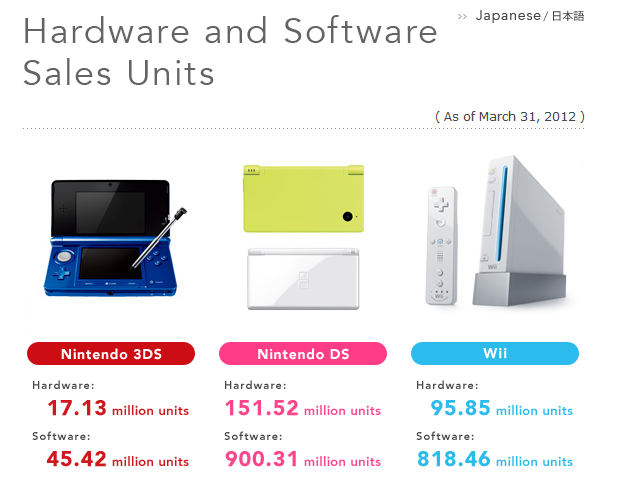
(*)April 25, 2011Nintendo Co. announced today its consolidated results for the fiscal year ended March 31,2012 (April 1, 2011 to March 31, 2012)
Consolidated Results For the Year Ended March 31, 2012 (Million Yen)
NDS Worldwide Hardware Unit Sales (Unit:Million)
NDS Worldwide Software Unit Sales (Unit:Million)Code:Ap-Jn Jl-Sp Oc-Dc Ja-Mr FY LTD FY 2004/05 - - 2.84 2.42 5.26 5.26 FY 2005/06 1.29 2.19 5.69 2.29 11.46 16.72 FY 2006/07 4.54 5.55 8.79 4.67 23.55 40.27 FY 2007/08 7.00 6.37 11.14 5.81 30.32 70.59 FY 2008/09 6.96 6.78 11.89 5.56 31.19 101.78 FY 2009/10 5.97 5.73 11.65 3.76 27.11 128.89 FY 2010/11 3.15 3.54 9.01 1.82 17.52 146.42 FY 2011/12 1.44 1.14 2.06 0.46 5.10 151.52
Wii Worldwide Hardware Unit Sales (Unit:Million)Code:Ap-Jn Jl-Sp Oc-Dc Ja-Mr FY LTD FY 2004/05 - - 5.01 5.48 10.49 10.49 FY 2005/06 5.33 7.98 22.59 14.05 49.95 60.44 FY 2006/07 18.35 24.79 50.65 29.75 123.54 183.98 FY 2007/08 34.26 41.23 71.39 38.75 185.63 369.61 FY 2008/09 36.58 48.43 78.77 33.53 197.31 566.92 FY 2009/10 29.09 42.06 50.22 30.22 151.59 718.5 FY 2010/11 22.42 32.42 44.15 21.99 120.98 839.48 FY 2011/12 12.13 16.86 22.21 9.62 60.82 900.31
Wii Worldwide Software Unit Sales (Unit:Million)Code:Ap-Jn Jl-Sp Oc-Dc Ja-Mr FY LTD FY 2006/07 - - 3.08 2.76 5.84 5.84 FY 2007/08 3.43 3.90 6.98 4.31 18.62 24.46 FY 2008/09 5.17 4.92 10.42 5.43 25.94 50.4 FY 2009/10 2.23 3.53 11.29 3.48 20.53 70.93 FY 2010/11 3.04 1.93 8.75 1.36 15.08 86.01 FY 2011/12 1.56 1.79 5.61 0.88 9.84 95.85
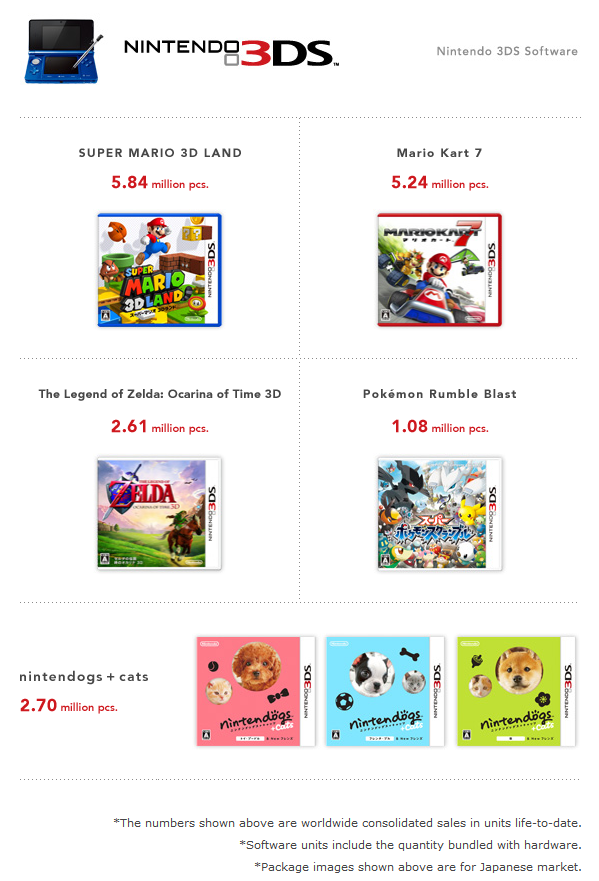
3DS Worldwide Unit Sales (Unit:Million)Code:Ap-Jn Jl-Sp Oc-Dc Ja-Mr FY LTD FY 2006/07 - - 16.37 12.46 28.83 28.83 FY 2007/08 15.98 21.0 47.38 35.25 119.61 148.44 FY 2008/09 40.4 41.0 82.39 40.79 204.58 353.02 FY 2009/10 31.07 45.14 80.43 35.17 191.81 544.83 FY 2010/11 28.17 37.04 85.33 20.72 171.26 716.09 FY 2011/12 13.44 23.01 52.61 13.31 102.37 818.46
Code:Hardware Sales Ap-Jn Jl-Sp Oc-Dc Ja-Mr FY LTD FY 2010/11 - - - 3.61 3.61 3.61 FY 2011/12 0.71 2.36 8.36 2.10 13.53 17.13 Software Sales Ap-Jn Jl-Sp Oc-Dc Ja-Mr FY LTD FY 2010/11 - - - 9.43 9.43 9.43 FY 2011/12 4.53 3.60 19.91 7.96 36.00 45.42