-
Hey, guest user. Hope you're enjoying NeoGAF! Have you considered registering for an account? Come join us and add your take to the daily discourse.
You are using an out of date browser. It may not display this or other websites correctly.
You should upgrade or use an alternative browser.
You should upgrade or use an alternative browser.
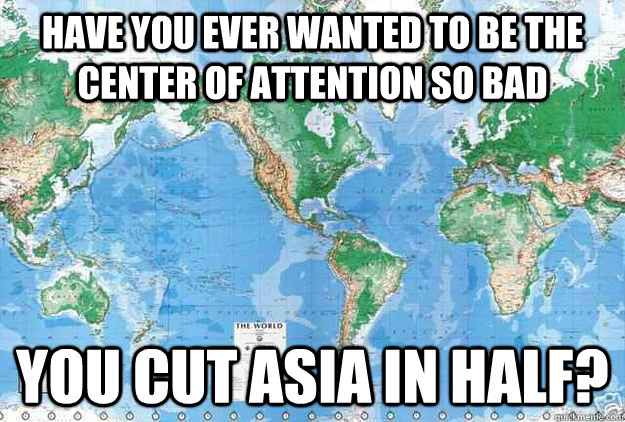
I never knew the world map was actually like this
- Thread starter nhlducks35
- Start date
- Status
- Not open for further replies.
Guys, guys. I'm pretty sure this is a joke.
Good lord I hope so...
And even the topic at hand from the OP is a little concerning.
What are people learning in school these days?
I remember learning fairly early on that there were different ways a map can be designed, and in some cases cause distortion to the size of various countries and continents...
Angelus Errare
Banned
It's called a "Globe"
Wouldn't most globes be inaccurate since they're perfect spheres when earth is an oblate spheroid?
EmCeeGramr
Member


Meh, if you want to compare continent sizes etc., this is pretty much the only way to represent the actual land mass on a 2D plane:

Nice spelling, Steven Kay.
j_k_redtail
Member
Because, who cares about Greenland, right? Haha

In all seriousness, we had a lot of maps in the house growing up, bought in the late 80s and early nineties, so I learned how to date maps based on what Eastern Europe looked like.
As I've gotten older, the above became my preferred projection: accurate size and shape, even if it does look a bit funky.
They launched people way up high and had them describe what it looked like when they came down.Pretty much this, it looks so cool, yet it's no different really.
I think my mind is blown more by the fact that pretty accurate maps were made when cartographers had nothing but boats to go on. I do not for the life of me understand how they put world maps together? Can someone explain?
No joke.
Ok, joke, I find it absolutely amazing, too.
The Albatross
Member
Best would be this:

To scale and also reflective of the fact we live on a globe.
This is the only map that I've ever really known..
Cymbal Head
Banned
I don't think I ever realized how much of the planet's landmass is in the northern hemisphere.
The Albatross
Member
Are educational maps in North-America really like this?
No. I've never seen them split like that, ever.
shanshan310
Member
Pretty normal for maps to center on whatever market they're being produced for. Where should it be centered?
US map put US in center is...bad? Seems like a common sense thing to do.
You'd think they'd make the map so that any other continent was clearly visible. Its hard to make out much when the Eurasian continent is cut in half. What's the point of having a map of the world when you can only really see the Americas?
I had a history teacher in high school that hated the map the school supplied him because it placed the US in the middle of it and all the other continents were put on the sides.it always baffled me that the USA was bigger than Canada in american printed text books.
It was an unorthodox map.
Partial Gamification
Banned
great thread but no love for google earth?
Historic maps and other extras, free. Get those 2D maps ouf of classrooms altogether when it comes to the globe.

Historic maps and other extras, free. Get those 2D maps ouf of classrooms altogether when it comes to the globe.

This is very scary and creepy.
I now understand why Africa truly is the cradle of humanity.
Yup, I always forget just how absolutely gigantic it is.
Egads. I would have laughed in the face of whoever was 'teaching' that class (I'm a geography major).Wasn't Mercator projection racist in origin? It was created to make Africa smaller in size than it really is in comparison to North America. At least that's what I learned in my undergrad class.
All projections take a 3D sphere or spheroid (described in what is called the datum) and unwrap it onto a 2D plane. The earth is actually quite bumpy so there are many datums, some are more or less accurate for different areas. The one most people should be familiar with is World Geodetic System 1984 (WGS84), which is the datum used for GPS systems.
People need projected systems for a number of reasons, most notably the requirement that we be able to measure distances between objects in normal linear units (meters and feet, for example). On a geographic coordinate system you measure differences in location using decimal degrees - which is not ideal as the distance one degree of longitude covers is different at the poles than at the equator. So distances and areas are right out.
ALL projected coordinate systems distort one or more of the following features during the transformation from 3D to 2D. ALL OF THEM. Some projections try to force the errors away from the area of interest (e.g. why the poles are so distorted in Mercator).
SHAPE: Maps that maintain local shape and angles are known as conformal. It's impossible to perfectly preserve shape for very large areas though.
AREA: Maps that preserve the area are known as equal area. Shape, angles, and scale are distorted, but this may not be obvious at small areas (especially around the point of tangency).
DISTANCE: Maps that preserve distances between points are known as equidistant. These distort shape to some extent. There is always some distortion of distance in some areas.
DIRECTION: Azimuthal projections preserve distances along the curved surface of the earth (e.g. great circle arcs). Obviously popular for aircraft (pioneered for use by intercontinental bombers and passenger aircraft).
PETERS PROJECTION: This is a cylindrical projection with points of tangency at the 45 degree N/S parallels which is why Canada, Russia, and Antarctica are still grossly off-looking. It distorts shape east-west of those latitudes. It maintains area (the main point here) and distorts direction and distance. It's actually not a very useful projection except for showing the entire world. You'll never see it used for showing countries or even entire continents.
MERCATOR PROJECTION: Developed to provide accurate compass bearings for sea travel (obviously of importance, hence the longevity even now). Shapes are preserved but area gets very distorted near the poles. Direction (the main point) is preserved. These lines are true bearings but do not necessarily show shortest distance. Scale is maintained near the equator but distorted near the poles.
Egads. I would have laughed in the face of whoever was 'teaching' that class (I'm a geography major).
All projections take a 3D sphere or spheroid (described in what is called the datum) and unwrap it onto a 2D plane. The earth is actually quite bumpy so there are many datums, some are more or less accurate for different areas. The one most people should be familiar with is World Geodetic System 1984 (WGS84), which is the datum used for GPS systems.
People need projected systems for a number of reasons, most notably the requirement that we be able to measure distances between objects in normal linear units (meters and feet, for example). On a geographic coordinate system you measure differences in location using decimal degrees - which is not ideal as the distance one degree of longitude covers is different at the poles than at the equator. So distances and areas are right out.
ALL projected coordinate systems distort one or more of the following features during the transformation from 3D to 2D. ALL OF THEM. Some projections try to force the errors away from the area of interest (e.g. why the poles are so distorted in Mercator).
SHAPE: Maps that maintain local shape and angles are known as conformal. It's impossible to perfectly preserve shape for very large areas though.
AREA: Maps that preserve the area are known as equal area. Shape, angles, and scale are distorted, but this may not be obvious at small areas (especially around the point of tangency).
DISTANCE: Maps that preserve distances between points are known as equidistant. These distort shape to some extent. There is always some distortion of distance in some areas.
DIRECTION: Azimuthal projections preserve distances along the curved surface of the earth (e.g. great circle arcs). Obviously popular for aircraft (pioneered for use by intercontinental bombers and passenger aircraft).
PETERS PROJECTION: This is a cylindrical projection with points of tangency at the 45 degree N/S parallels which is why Canada, Russia, and Antarctica are still grossly off-looking. It distorts shape east-west of those latitudes. It maintains area (the main point here) and distorts direction and distance. It's actually not a very useful projection except for showing the entire world. You'll never see it used for showing countries or even entire continents.
MERCATOR PROJECTION: Developed to provide accurate compass bearings for sea travel (obviously of importance, hence the longevity even now). Shapes are preserved but area gets very distorted near the poles. Direction (the main point) is preserved. These lines are true bearings but do not necessarily show shortest distance. Scale is maintained near the equator but distorted near the poles.
Geeze Mr. Know-it-all. Great answer. I remember learning all this but have long since forgotten in such detail to give this type of answer.
What's your end goal as a geography major?
How About No
Member
I like this one. Looks like a Final Fantasy map!
Rhomega Beta
Member
Peters Projection flipped is truly the best map.

I get dizzy if I look at this long enough.
Finishing the last chapter of my thesis. I'm using spatial statistical methods (notably, geographically weighted regression) to model Cesium-137 radioisotope activity across large heterogeneous areas. Geography is a large-tent discipline with lots of different areas of expertise; our department has people involved in climate modeling, hazards analysis and threat projection in coastal areas, spatial analysis, world systems models, business location siting, earth remote sensing to detect bark beetle infestations, etc. We're a pretty quantitative department though, others focus more on cartography and data visualization, and so on. I also have a degree in archaeology but there's not good jobs in that fieldWhat's your end goal as a geography major?

Then use a globe. Dont touch the map.It's called a "Globe"
it always baffled me that the USA was bigger than Canada in american printed text books.
what.... ive never, ever, seen a map that showed USA as bigger than Canada.
Finishing the last chapter of my thesis. I'm using spatial statistical methods (notably, geographically weighted regression) to model Cesium-137 radioisotope activity across large heterogeneous areas. Geography is a large-tent discipline with lots of different areas of expertise; our department has people involved in climate modeling, hazards analysis and threat projection in coastal areas, spatial analysis, world systems models, business location siting, earth remote sensing to detect bark beetle infestations, etc. We're a pretty quantitative department though, others focus more on cartography and data visualization, and so on. I also have a degree in archaeology but there's not good jobs in that field
Little over my head. I had to sit on a panel for a job fair at the local university and I didn't offer much of a hopeful job outlook for the soon to be grads in terms of GIS
This map is the one painted on some of the walls in the Social Science classrooms in my college...
GIS tech positions are saturated (e.g. basically data entry). GIS analysis, well ... you can start out making 60K+ minimum depending on what your specific expertise is.Little over my head. I had to sit on a panel for a job fair at the local university and I didn't offer much of a hopeful job outlook for the soon to be grads in terms of GIS
MWS Natural
Member
Yup. It's amazing just how many people don't realize just how HUGE Africa is.
They don't realize because what's taught in schools is wrong.
GIS tech positions are saturated (e.g. basically data entry). GIS analysis, well ... you can start out making 60K+ minimum depending on what your specific expertise is.
Lots of competition for the analyst positions. We only have about 9 with 20+ tech positions. Makes it difficult come promotion time with so much competition. I consider myself lucky that I entered the workforce about 10 years ago so it wasn't nearly as saturated as it is now.
Interesting. What kind of analysis does your business do? Most of the smaller companies around here do environmental monitoring and compliance contracting. There's also some USGS and Forest Service offices around. Analyst positions for the state (any of the NW ones) are insultingly compensated. I can afford to be more picky than most, although I'm currently on an academic trackLots of competition for the analyst positions. We only have about 9 with 20+ tech positions. Makes it difficult come promotion time with so much competition. I consider myself lucky that I entered the workforce about 10 years ago so it wasn't nearly as saturated as it is now.
~ElectricBlue187
Member
Interesting. What kind of analysis does your business do? Most of the smaller companies around here do environmental monitoring and compliance contracting. There's also some USGS and Forest Service offices around. Analyst positions for the state (any of the NW ones) are insultingly compensated. I can afford to be more picky than most, although I'm currently on an academic track
I've yet to find a GIS position's salary insulting and I'm in management
Interesting. What kind of analysis does your business do? Most of the smaller companies around here do environmental monitoring and compliance contracting. There's also some USGS and Forest Service offices around. Analyst positions for the state (any of the NW ones) are insultingly compensated. I can afford to be more picky than most, although I'm currently on an academic track
I work in commercial real estate. Most of the analysts are, at the very least, expected to have a firm understanding of analog models and apply them to site selection/sales forcasting. Other than that a lot of employee commute studies but much of that has been templated over the years so the process is fairly painless. Lots of cartography. Heavy focus on graphics since much of what we do is also considered marketing. Illustrator is a close second to Arc and MapInfo.
We've managed to up the starting salaries for all of our GIS positions but I'd still consider them extremely low relative to my percieved worth of the industry but then again I'm biased. GIS Manager jobs can have massive variance based off my pay and salary research I've done.
- Status
- Not open for further replies.
Similar threads
- 31
- 2K
Madonis
replied