Hardware:
Software:
Random information:
- Information which has GFK/Media Control/Chart-Track/Nielsen as a source only accounts for the UK, Germany, France and Spain - these four markets make up 75-80 percent of all European sales.
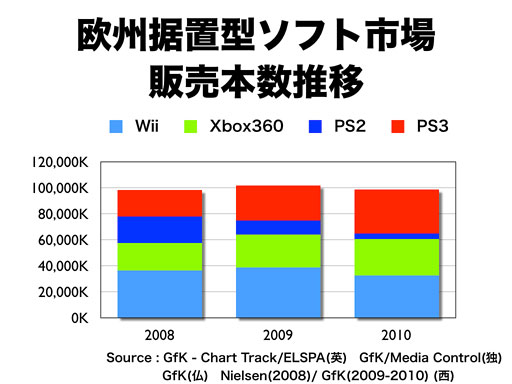
- Only Xbox 360 sales slightly increased, despite being still lower than those of both competitors.
- Wii marketshare down 5 percent, Xbox 360 up 4 percent, PS3 up 1 percent
Top 20 charts:
Germany
France
Spain
UK (No DS titles included as of September?)
Software:
Random information:
- Information which has GFK/Media Control/Chart-Track/Nielsen as a source only accounts for the UK, Germany, France and Spain - these four markets make up 75-80 percent of all European sales.
- Only Xbox 360 sales slightly increased, despite being still lower than those of both competitors.
- Wii marketshare down 5 percent, Xbox 360 up 4 percent, PS3 up 1 percent
Top 20 charts:
Germany
France
Spain
UK (No DS titles included as of September?)
Rolf NB said:Calling dibs on this chore (so nobody else has to do it).
Will edit stuff in here.
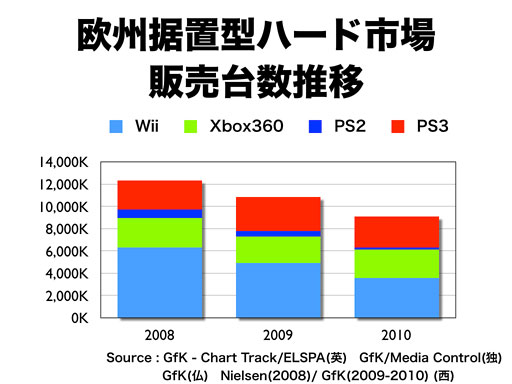
Console hardware:
(base: 133 pixels <=> 12M; 1 pixel <~> 90.2k)Code:2008 2009 2010 360 2662k 2368k 2549k PS2 767k 474k 158k PS3 2617k 3068k 2774k Wii 6361k 4962k 3609k
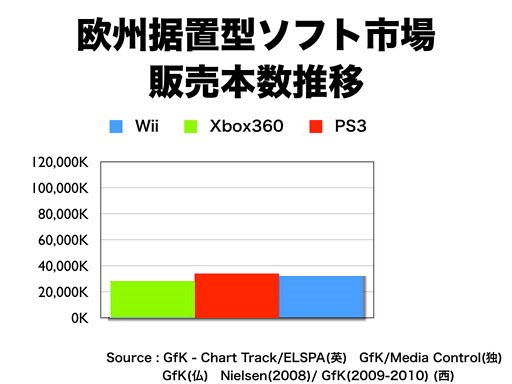
Console software:
(base: 131 pixels <=> 100M; 1 pixel <~> 763.36k)Code:2008 2009 2010 360 20.99M 25.00M 27.86M PS2 20.23M 10.50M 4.20M PS3 20.23M 26.53M 33.40M Wii 36.26M 38.55M 32.44M
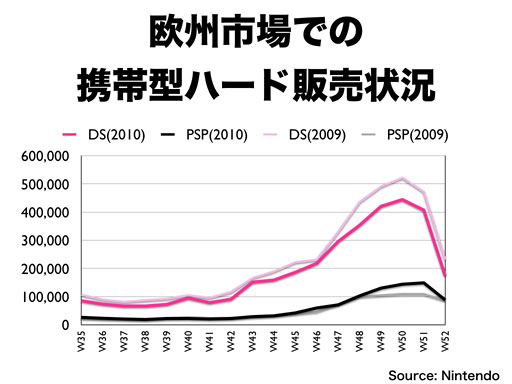
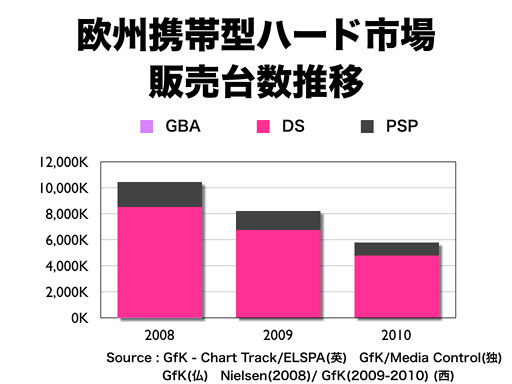
Handheld hardware:
(base: 131 pixels <=> 10M; 1 pixel <~> 76.336k)Code:2008 2009 2010 GBA ~38k 0 0 NDS 8.44M 6.72M 4.77M PSP 1.91M 1.45M 0.97M
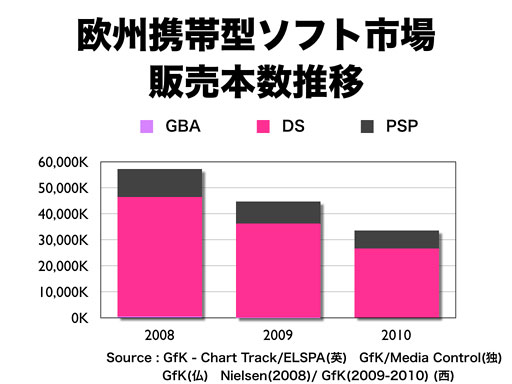
Handheld software:
(base: 131 pixels <=> 50M; 1 pixel <~> 381.7kk)Code:2008 2009 2010 GBA 0.76M 0.29M 0 NDS 45.42M 35.78M 26.53M PSP 10.69M 7.92M 6.77M