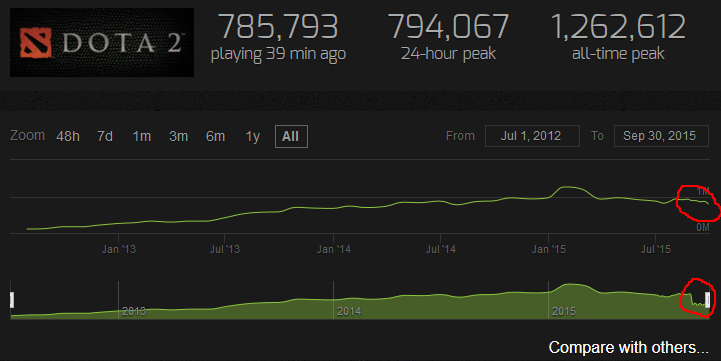
Something is weird with the charts. The custom one (top) and the all time one (bottom) differ. The drop in the all time charts around September disappears when you set the custom chart to all time. (The TF2 and CSGO charts have the exact same problem)
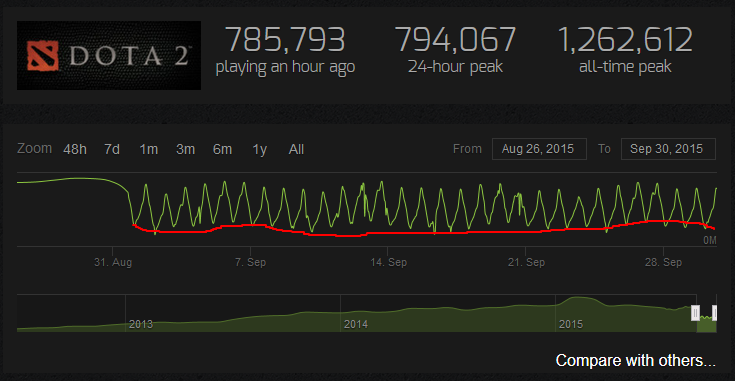
I think the bottom charts somehow bases the number of players in September on the minimum amount of players in the 24 h cycle.
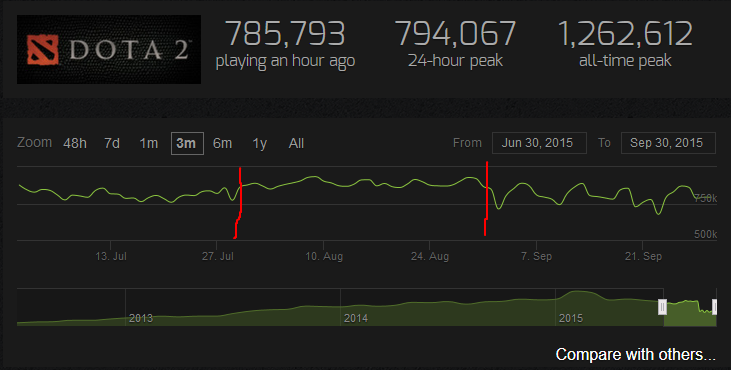
If you take the last three months, it seems like September's numbers (right) are similar to the numbers of July (left). July has min 780K max 870K players per day, September min 680K max 890K
EDIT: The %gain is broken for September (at least right now). Look at the 3 months chart of GS:GO, Its clear that September has more players than August. But the %gain from August to September is negative.
http://steamcharts.com/app/730#3m