-
Hey, guest user. Hope you're enjoying NeoGAF! Have you considered registering for an account? Come join us and add your take to the daily discourse.
You are using an out of date browser. It may not display this or other websites correctly.
You should upgrade or use an alternative browser.
You should upgrade or use an alternative browser.
PAL Charts - Week 17, 2014
- Thread starter Bruno MB
- Start date
ethomaz
Banned
TF bundles keep it going... well at least the XO version.Titanfall still selling, positive word of mouth will keep it going.
Miles Quaritch
Member
TF bundles keep it going... well at least the XO version.
So it's selling systems? I'm sure MS and EA are happy either way. Brand new IP seeing the kinds of leg TF is seeing is only ever good news.
Miles Quaritch
Member
LTD of Titanfall 360 and XB1 anyone???
We know the X1 version sold 115k at launch and the 360 version sold 34k at launch.
Hard to say where the numbers currently sit.
ethomaz
Banned
I'm not sure it selling system... I meant most TF sales come from people that are buying XO weekly... the XO sales seem to be the same pre-TF launch... just now almost every sales account a free TF units too.So it's selling systems? I'm sure MS and EA are happy either way. Brand new IP seeing the kinds of leg TF is seeing is only ever good news.
We know the X1 version sold 115k at launch and the 360 version sold 34k at launch.
Hard to say where the numbers currently sit.
Thanks, looks like it's probably well above 200k now. Didn't Infamous give us a rough idea of week 2? Was either 60k~ or 30k~
http://www.neogaf.com/forum/showpost.php?p=106396043&postcount=32
Yeah,
Week 1 - 115k
Week 2 - 40k
Week 3 - 23k
Week 4 - down 36% 15k~
Week 5 - same placing as previous week, around 15k?
Week 6 - 12k+
Week 7 - 12k+
Total is somewhere around 235k~
I'm not sure it selling system... I meant most TF sales come from people that are buying XO weekly... the XO sales seem to be the same pre-TF launch... just now almost every sales account a free TF units too.
Well if that was true then surely Fifa or Forza shoulve charted much higher for XO.
ethomaz
Banned
Why? TF bundle is cheaper than the others...Well if that was true then surely Fifa or Forza shoulve charted much higher for XO.
FIFA and Forza bundle are ~£430... TF Bundle ~£370... and Forza and FIFA bundle are hard to find.
SwiftDeath
Member
Why? TF bundle is cheaper than the others...
FIFA and Forza bundle are ~£430... TF Bundle ~£370... and Forza and FIFA bundle are hard to find.
Not to mention that Fifa and Forza are now 4 month old games with used games on shelves everywhere at a far greater discount than TF used would have I imagine
--------------------------
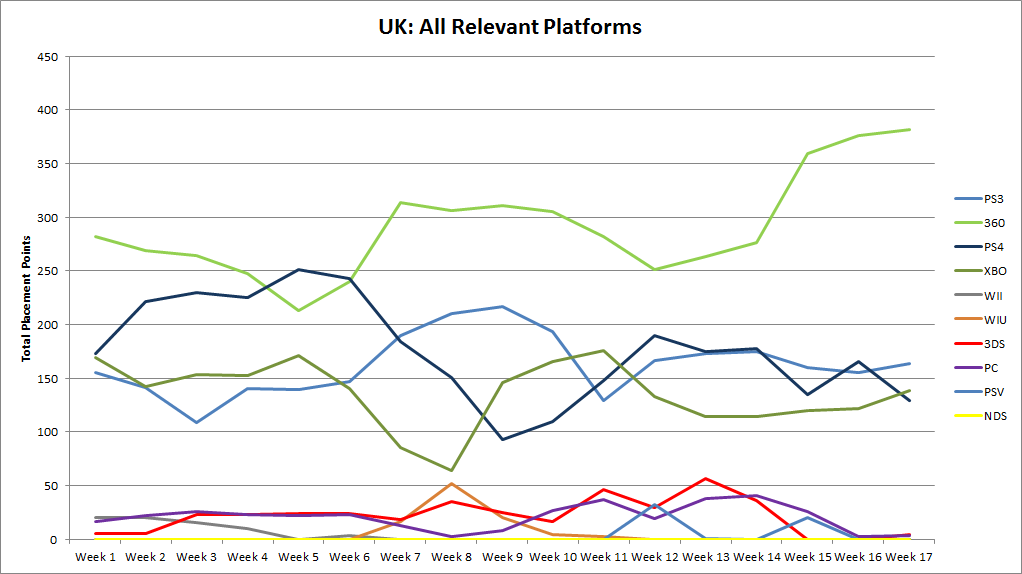
Anyways so I've been trying to find a way of graphing the information we get from PAL Charts
Previously I simply graphed how many software SKUs charted weekly which while somewhat representative of how each platform was doing software sales-wise failed to take into account the position each of those software SKUs held [i.e. it is most likely that the software SKU in position 1 outsold the software SKUs in position 39 and 40 combined but they would previously be counted the same]
So for any interested posters, I humbly present Total Placement Points. Very simply really, the software SKU in position 1 receives 40 points, position two 39, position 3 38, and so on down until position 40 that receives 1 point. This way the charts will accurately reflect not only the number of software SKUs that chart for each platform but their position relative to other software.
Now a big caveat is that this in no way accurately reflects the sales discrepancy between software SKUs but it is an objectively better method to track the PAL charts graphically then my previous one.
--------------------------
Without further ado


--------------------------
A couple points of interest
- If you look at the 2nd chart, you'll notice that the XBO charted higher than the PS4 this week. If you were to count the software SKUs that charted this week you'd actually notice that PS4 has one more title. With this new method, XBO is higher due to having the number 1 position [or generally higher positions]
- 360 is on an increase in software sales it would seem. 16 charted positions last week, 15 this week. PS3 is relatively stable and has actually increased over its baseline a little. 10 over 8. This suggest lower adoption of next-gen consoles in the last 4 weeks or so compared to the previous 4 weeks
- The gap between Family performances has widened this week between Xbox and PS. 360 is doing most of the work although XB1's TF is also having a large effect being so highly charted. It's a pity TF is bundled with XB1 as it would have been great to see how it performed in the UK as a normal SKU only.
Vita Top 10:
1, Football Manager 2014.
2, Demon Gaze.
3, FIFA 14.
4, Killzone Mercenary.
5, Tearaway.
6, Final Fantasy X/X2 HD Remaster.
7, Invizimals: The Alliance.
8, LEGO: The Hobbit.
9, The LEGO Movie Videogame.
10, The Sly Trilogy.
What a haphazard collection of games. I love it.
Yo dave did they do any marketing for football manager over there?
Please give any feedback you have on my Total Placement Points method. I would love to improve my charting methods
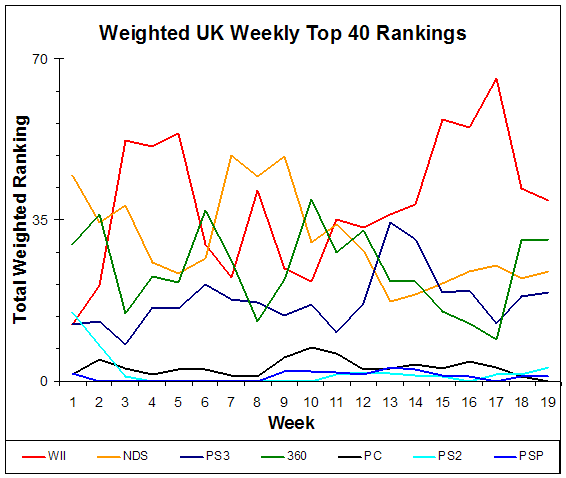
Someone used to do this, but with positions weighted by the average difference in sales between positions from the Japanese charts. The difference between positions is generally a lot higher at the top, decreasing to essentially little difference at the bottom.
Edit: Here we are
Yo dave did they do any marketing for football manager over there?
I'm not dave, but no, not really, however, the most recent Football manager PC update has PSVita cross save on the main menu now and it's all over the update notes/forums, so knowledge of the game is there in the football manager community, though they may not know exactly what a vita is.
SwiftDeath
Member
Someone used to do this, but with positions weighted by the average difference in sales between positions from the Japanese charts. The difference between positions is generally a lot higher at the top, decreasing to essentially little difference at the bottom.
Edit: Here we are
Intriguing. I wonder why Donny stopped. I have thought about the weighted aspect you speak of because the difference between the Top SKUs would indeed be far greater than the difference between the bottom SKUs. If only there was a couple weeks wherein which we got near complete sales numbers and then I'd have a baseline to create the weighting. Otherwise it would just be me guessing at it
Hmm...I'll ponder on it a bit. Might PM Donny to see if he has any suggestions on the weighting
theprodigy
Member
Someone used to do this, but with positions weighted by the average difference in sales between positions from the Japanese charts. The difference between positions is generally a lot higher at the top, decreasing to essentially little difference at the bottom.
Edit: Here we are
that would be nice, but do we know the actual formula for it?
meanwhile, do that chart for Germany and France too SwiftDeath

edit: also PS4=green threw me for a loop, you should change that
SwiftDeath
Member
that would be nice, but do we know the actual formula for it?
meanwhile, do that chart for Germany and France too SwiftDeath
edit: also PS4=green threw me for a loop, you should change that
I'll get on the Germany version of the charts but we don't have Week 17 for Germany yet do we?
I'll try to update the UK charts to fit the color patterns I suppose :\
Edit: Updated my charts to better reflect Platform Coloring. Does Nintendo have any set colors? White maybe?
GoofsterStud
Member
So it's selling systems?
If you were in the market for the console why wouldn't you get the one with a free game and a free month of gold for the same price or cheaper like it's been in the US. I can't think of any reason.
Intriguing. I wonder why Donny stopped. I have thought about the weighted aspect you speak of because the difference between the Top SKUs would indeed be far greater than the difference between the bottom SKUs. If only there was a couple weeks wherein which we got near complete sales numbers and then I'd have a baseline to create the weighting. Otherwise it would just be me guessing at it
Hmm...I'll ponder on it a bit. Might PM Donny to see if he has any suggestions on the weighting
I used to do that every single week when I was managing the PAL charts threads, based on Donny's data. The caveat of course is that the formula was derived from very few data points.
SwiftDeath
Member
I used to do that every single week when I was managing the PAL charts threads, based on Donny's data. The caveat of course is that the formula was derived from very few data points.
Thanks for the input. For now I might just continue with my unweighted method as i have never seen any pal thread where we felt comfortable estimating the sales numbers for more than 5 or 6 of the 40 odd SKUs
I could perhaps try to create a bracketed approach. First 5, 6 - 15, 16 - 25 and so on. I'll think about it then
Was there any particular reason you guys stopped?
theprodigy
Member
I'll get on the Germany version of the charts but we don't have Week 17 for Germany yet do we?
I'll try to update the UK charts to fit the color patterns I suppose :\
Edit: Updated my charts to better reflect Platform Coloring. Does Nintendo have any set colors? White maybe?
Playstation=black, Wii/Wii U=blue?
I dunno
edit: also maybe some inverse logarithmic function? lol this is lame, why can't the whole world have multiple trackers like Japan does
SwiftDeath
Member
Prodigy I'll think on the colors. I don't really like the idea of switching the PS from blue to something else but it's a possibility. Think it might confuse people more though
Also I'm not sure if there's a point in doing charts for France considering they give out all of 5 placements :\
Been debating if I should even bother for Australia and New Zealand since they're only 10 a piece
Also I'm not sure if there's a point in doing charts for France considering they give out all of 5 placements :\
Been debating if I should even bother for Australia and New Zealand since they're only 10 a piece
Thanks for the input. For now I might just continue with my unweighted method as i have never seen any pal thread where we felt comfortable estimating the sales numbers for more than 5 or 6 of the 40 odd SKUs
I could perhaps try to create a bracketed approach. First 5, 6 - 15, 16 - 25 and so on. I'll think about it then
Was there any particular reason you guys stopped?
Well I just stopped taking care of the threads at some point, and the person who filled in (I think dabra?) didn't carry on with that stuff. I'm not sure I even gave him the formula I got from donny tbh. To be fair that was like, 5 years ago
Thanks. Here's hoping that Metro will pick up where The Guardian left off and continue to provide splits.
Surprising that H4 didn't chart...
Unless the bundle is different in the UK, the one I just bought in the US included Forza Horizon and a download code for Borderlands 2. The previous holiday bundle was Tomb Raider and Halo 4.
SwiftDeath
Member
Well I just stopped taking care of the threads at some point, and the person who filled in (I think dabra?) didn't carry on with that stuff. I'm not sure I even gave him the formula I got from donny tbh. To be fair that was like, 5 years ago
Muhahaha I have resurrected something I have never seen before from over 5 years ago
I'm a bit behind the curve aren't I? lol
For now I think I'll continue with my obviously imperfect method that doesn't weight the top end until I can find compelling data to suggest a weighting split for at least one week
theprodigy
Member
Muhahaha I have resurrected something I have never seen before from over 5 years ago
I'm a bit behind the curve aren't I? lol
For now I think I'll continue with my obviously imperfect method that doesn't weight the top end until I can find compelling data to suggest a weighting split for at least one week
I wonder, maybe you could grab the average #s for Famitsu's top 30 over the course of a year, different markets but it might be worth a shot
don't do it now though, show me the German chart first
SwiftDeath
Member
I wonder, maybe you could grab the average #s for Famitsu's top 30 over the course of a year, different markets but it might be worth a shot
don't do it now though, show me the German chart first
I was going to wait until we got Week 17 to post the German Chart. If you really want I don't mind doing the Chart up to Week 16 today though I suppose
As for comparing to other trackers for relevance, I wonder if perhaps I could try to utilize NPD leaks for the Top 10 weighting? As US is far closer to UK than Japan would be
Muhahaha I have resurrected something I have never seen before from over 5 years ago
I'm a bit behind the curve aren't I? lol
For now I think I'll continue with my obviously imperfect method that doesn't weight the top end until I can find compelling data to suggest a weighting split for at least one week
Here, a random one from 2008:
SwiftDeath
Member
Here, a random one from 2008:
Cool to see although without the formula or weighting breakdown I can't really apply it
Still though Wii and NDS. Man how Nintendo has fallen and if that's from the UK then wowza at their almost complete marketshare erosion. Can't be Germany because of the PC so it is probably UK, huh
Cool to see although without the formula or weighting breakdown I can't really apply it
Still though Wii and NDS. Man how Nintendo has fallen and if that's from the UK then wowza at their almost complete marketshare erosion. Can't be Germany because of the PC so it is probably UK, huh
Well you've got 19 data points for each console. You could go back to all these threads, write down the positions of each title for each console, and deduce the formula.
I'm sure there's a way with pixel counting and maths. It's not like you've got anything better to do anyway.
SwiftDeath
Member
Well you've got 19 data points for each console. You could go back to all these threads, write down the positions of each title for each console, and deduce the formula.
I'm sure there's a way with pixel counting and maths. It's not like you've got anything better to do anyway.
lol I don't even know how you guys developed the ranking formula let alone the weighting breakdown. I mean I pretty much just went "Keep it simple stupid" on mine because otherwise I'd get confused
lol I don't even know how you guys developed the ranking formula let alone the weighting breakdown. I mean I pretty much just went "Keep it simple stupid" on mine because otherwise I'd get confused
IIRC it was based on a few weeks worth of actual numbers from Famitsu, and donny averaged them and from that pulled a regression curve.
So it was like:
1 = 13.1
2 = 8.3
3 = 6.2
4 = 4.5
5 = 3.4
etc
So that was plotted in excel, and would give a "best fit" curve with the actual formula.
Of course the formula was likely not accurate at all at times, but it just gave some general idea.
SwiftDeath
Member
IIRC it was based on a few weeks worth of actual numbers from Famitsu, and donny averaged them and from that pulled a regression curve.
So it was like:
1 = 13.1
2 = 8.3
3 = 6.2
4 = 4.5
5 = 3.4
etc
So that was plotted in excel, and would give a "best fit" curve with the actual formula.
Of course the formula was likely not accurate at all at times, but it just gave some general idea.
I might try to do a Frankenstein type approach then. Utilize NPD leaked data for a few months to try and determine the weighting of the Top 10 generally, then utilize Famitsu or Media Creates to approximate the weighting for the rest. So maybe in a couple of months if I can remember to keep track
I might try to do a Frankenstein type approach then. Utilize NPD leaked data for a few months to try and determine the weighting of the Top 10 generally, then utilize Famitsu or Media Creates to approximate the weighting for the rest. So maybe in a couple of months if I can remember to keep track
Not sure that'll work as well. I mean, Famitsu used to give, sometines, actual UK charts sales. So it was based on that, at least.
I PM'd donny. He's still around but I haven't seen him in a PAL charts thread in like forever. Maybe he still has the actual formula.
theprodigy
Member
1/log(x+1), where x is chart position?
maybe, it'd make the gap between top positions pretty big and gaps from 20 onwards relatively meaningless, but idk just throwing stuff at that wall at this point
edit:
so much easier than logarithms, how did I not think of that instead >_>
maybe, it'd make the gap between top positions pretty big and gaps from 20 onwards relatively meaningless, but idk just throwing stuff at that wall at this point
edit:
Why not just 1/chart position? (or 40/chart position to keep it roughly scaled up to the old way)
so much easier than logarithms, how did I not think of that instead >_>
Graphics Horse
Member
Why not just 1/chart position? (or 40/chart position to keep it roughly scaled up to the old way)
SwiftDeath
Member
Why not just 1/chart position? (or 40/chart position to keep it roughly scaled up to the old way)
Personally I'd rather either base the weighting on some empirical data or maintain the relative positioning that my graphs do currently
SwiftDeath
Member
Actually now that I think of it I seem to remember that it wasn't a straight formula but rather a table with fixed values for positions 1 to 40. I think. Maybe. Sort of.
Man that was so long ago :/
That wouldn't surprise me as it would likely be closer to 3 or 4 formulas for different segments [Top 5, Next 10 and so on] then 1 formula that gets anything close to predicting the weight of all placements
Not sure that'll work as well. I mean, Famitsu used to give, sometines, actual UK charts sales. So it was based on that, at least.
I PM'd donny. He's still around but I haven't seen him in a PAL charts thread in like forever. Maybe he still has the actual formula.
Huh missed this post. Wow we got UK sales numbers? :\
Why I got to miss all of the good old days?
Visualante2
Member
Wonder if Trials retail will pay off for Ubisoft...
SwiftDeath
Member
I'm surprised at how low the split is for xb1 garden warfare. Too casual for xb1 audience?
Hmm if I had to theorize, a large portion of the active 360 base right now buying software would be young kids whose parents bought them one for minecraft thus something like PVZ:GW hits a perfect demographic as a COD-like game but okay for kids
The majority of XB1 buyers at this point in time will likely be an older demographic thus I would say it's the age of the demographics more than anything
theprodigy
Member
I'm bored, so platform totals for this week using 40/chart position:
360-99.14
XBO-29.78
PS3-23.79
PS4-16.30
3DS-1.08
PC-1.05
I feel like this weighs the top 5 way too heavily, but idk
360-99.14
XBO-29.78
PS3-23.79
PS4-16.30
3DS-1.08
PC-1.05
I feel like this weighs the top 5 way too heavily, but idk
Dragonborn
Member
TF bundles keep it going... well at least the XO version.
Of course, why would anyone buying one not get the bundle (even if they aren't interested in TF), especially with the fire sale like price cuts it keeps getting. Not to mention price cuts on the game itself. Do they even sell stand alone X1s anymore?
I'd be very surprised if it wasn't still selling well.
SwiftDeath
Member
I'm bored, so platform totals for this week using 40/chart position:
360-99.14 - 57.93%
XBO-29.78 - 17.4%
PS3-23.79 - 13.9%
PS4-16.30 - 09.52%
3DS-1.08 - 00.63%
PC-1.05 - 00.61%
I feel like this weighs the top 5 way too heavily, but idk
My method results in
Code:
360 | 382 | 46.6%
PS3 | 164 | 20%
XBO | 138 | 16.83%
PS4 | 129 | 15.73%
3DS | 4   | 0.49%
PC  | 3   | 0.37%
WII | 0   | 0%
WIU | 0   | 0%
I guess mine weighs the middle too heavily?
Under mine PS3 edges out XBO due to higher number of SKUs charting
theprodigy
Member
My method results in
Code:360 | 382 | 46.6% PS3 | 164 | 20% XBO | 138 | 16.83% PS4 | 129 | 15.73% 3DS | 4 | 0.49% PC | 3 | 0.37% WII | 0 | 0% WIU | 0 | 0%
I guess mine weighs the middle too heavily?
Under mine PS3 edges out XBO due to higher number of SKUs charting
Well I don't know if you noticed, but under 40/chart position, XBO Titanfall alone beats out all the PS4 games, which definitely feels off.
However, despite this I feel that overall something like that is more accurate, maybe take a square root or something so the top positions aren't that extreme?
idk
edit: here's that attempt:
360-32.97 (46.26%)
PS3-14.49 (20.33%)
XBO-11.43 (16.04%)
PS4-10.31 (14.47%)
3DS-1.04 (1.46%)
PC-1.03 (1.45%)
yeah that seems like a better fit
SwiftDeath
Member
Well I don't know if you noticed, but under 40/chart position, XBO Titanfall alone beats out all the PS4 games, which definitely feels off.
However, despite this I feel that overall something like that is more accurate, maybe take a square root or something so the top positions aren't that extreme?
idk
Again this is why I strongly feel the need for some level of empirical data to try and build a weighting around rather than guess at it
And I can't imagine that the XBO sku of TF came anywhere close to beating out all PS4's SKUs that charted this week in total sales
Especially because with the splits being this:
01 (01) TITANFALL (ELECTRONIC ARTS)
XBO (50%)
360 (48%)
PC (2%)
And with Minecraft 360 between them
02 (03) XBO TITANFALL (ELECTRONIC ARTS)
03 (04) 360 MINECRAFT: XBOX 360 EDITION (MICROSOFT)
04 (01) 360 TITANFALL (ELECTRONIC ARTS)
Both SKUs basically sold the same as Minecraft did this past week
I'd use a years average of Dengeki weekly Top 40s. NPD is monthly, only top 10, combined formats, and we don't even get numbers for the full top ten anyway. The idea is just to give a rough approximation over a period of time, not to be a true reflection of any individual week which can potentially deviate significantly from the norm.
Huh missed this post. Wow we got UK sales numbers? :\
That was rather rare.
Why I got to miss all of the good old days?
You've got much to learn, young padawan.
SwiftDeath
Member
I'd use a years average of Dengeki weekly Top 40s. NPD is monthly, only top 10, combined formats, and we don't even get numbers for the full top ten anyway. The idea is just to give a rough approximation over a period of time, not to be a true reflection of any individual week which can potentially deviate significantly from the norm.
Yeah I'll do something of the sort when I can find the time and will power to do so
You've got much to learn, young padawan.
Old sales-gaf sounds like best sales-gaf